Use Analyse Mode
Analyse Mode helps with identifying potential weak spots within your operation. It allows users to visualise barriers through a selected metadata type. For example, barriers could be visualised in the colour format selected for the metadata type ‘Barrier Condition’. This will allow users to quickly identify weak barriers in a large, complex bowtie diagram. Once you have gathered the necessary information related to the barrier under investigation, you can take the necessary actions to make improvements.
NOTE: Before using analyse mode, ensure you’ve added metadata to your barriers. Not sure where to start? Check out our tutorial, add and edit metadata.
Step 1: Click Analyse Mode in the toolbar.
Step 2: Select the Metadata Type from the drop-down list that you would like to analyse. Tick whether you would like to Greyscale Elements and/or Highlight Critical Barriers. 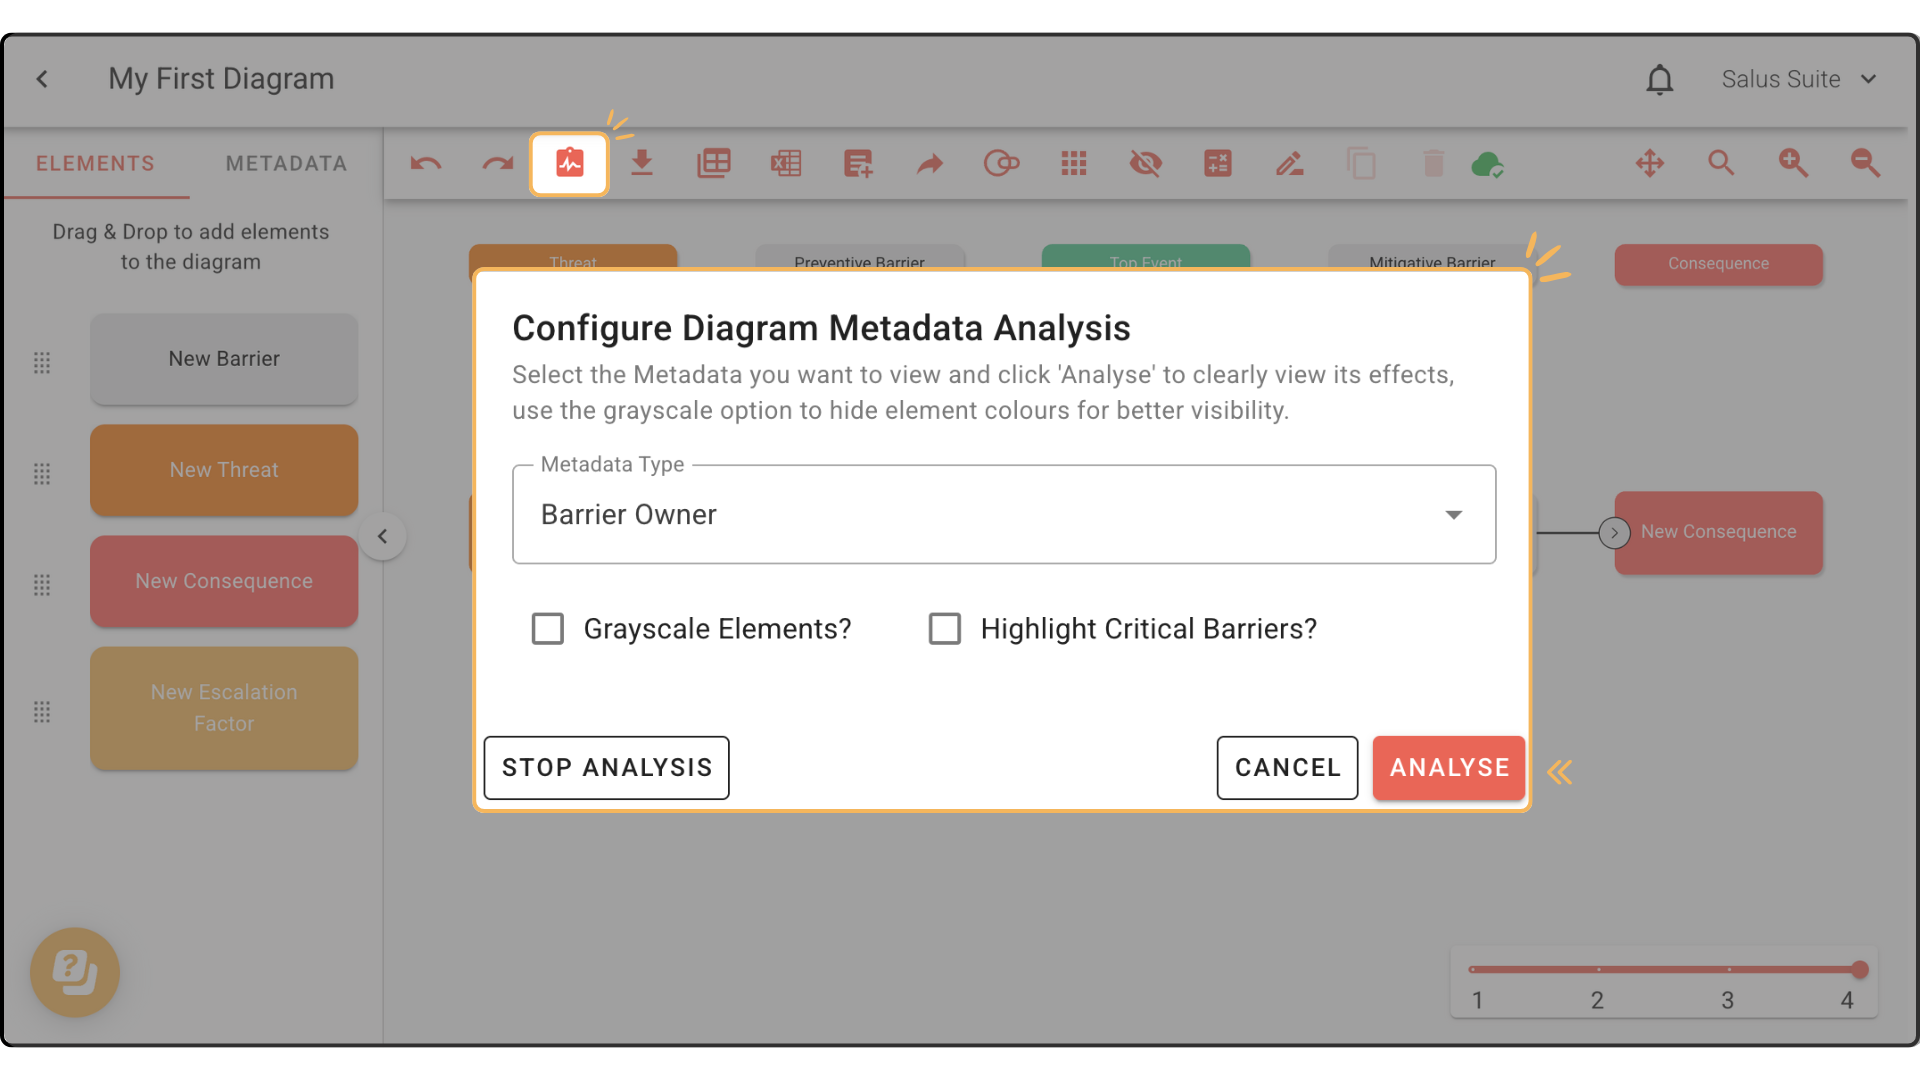
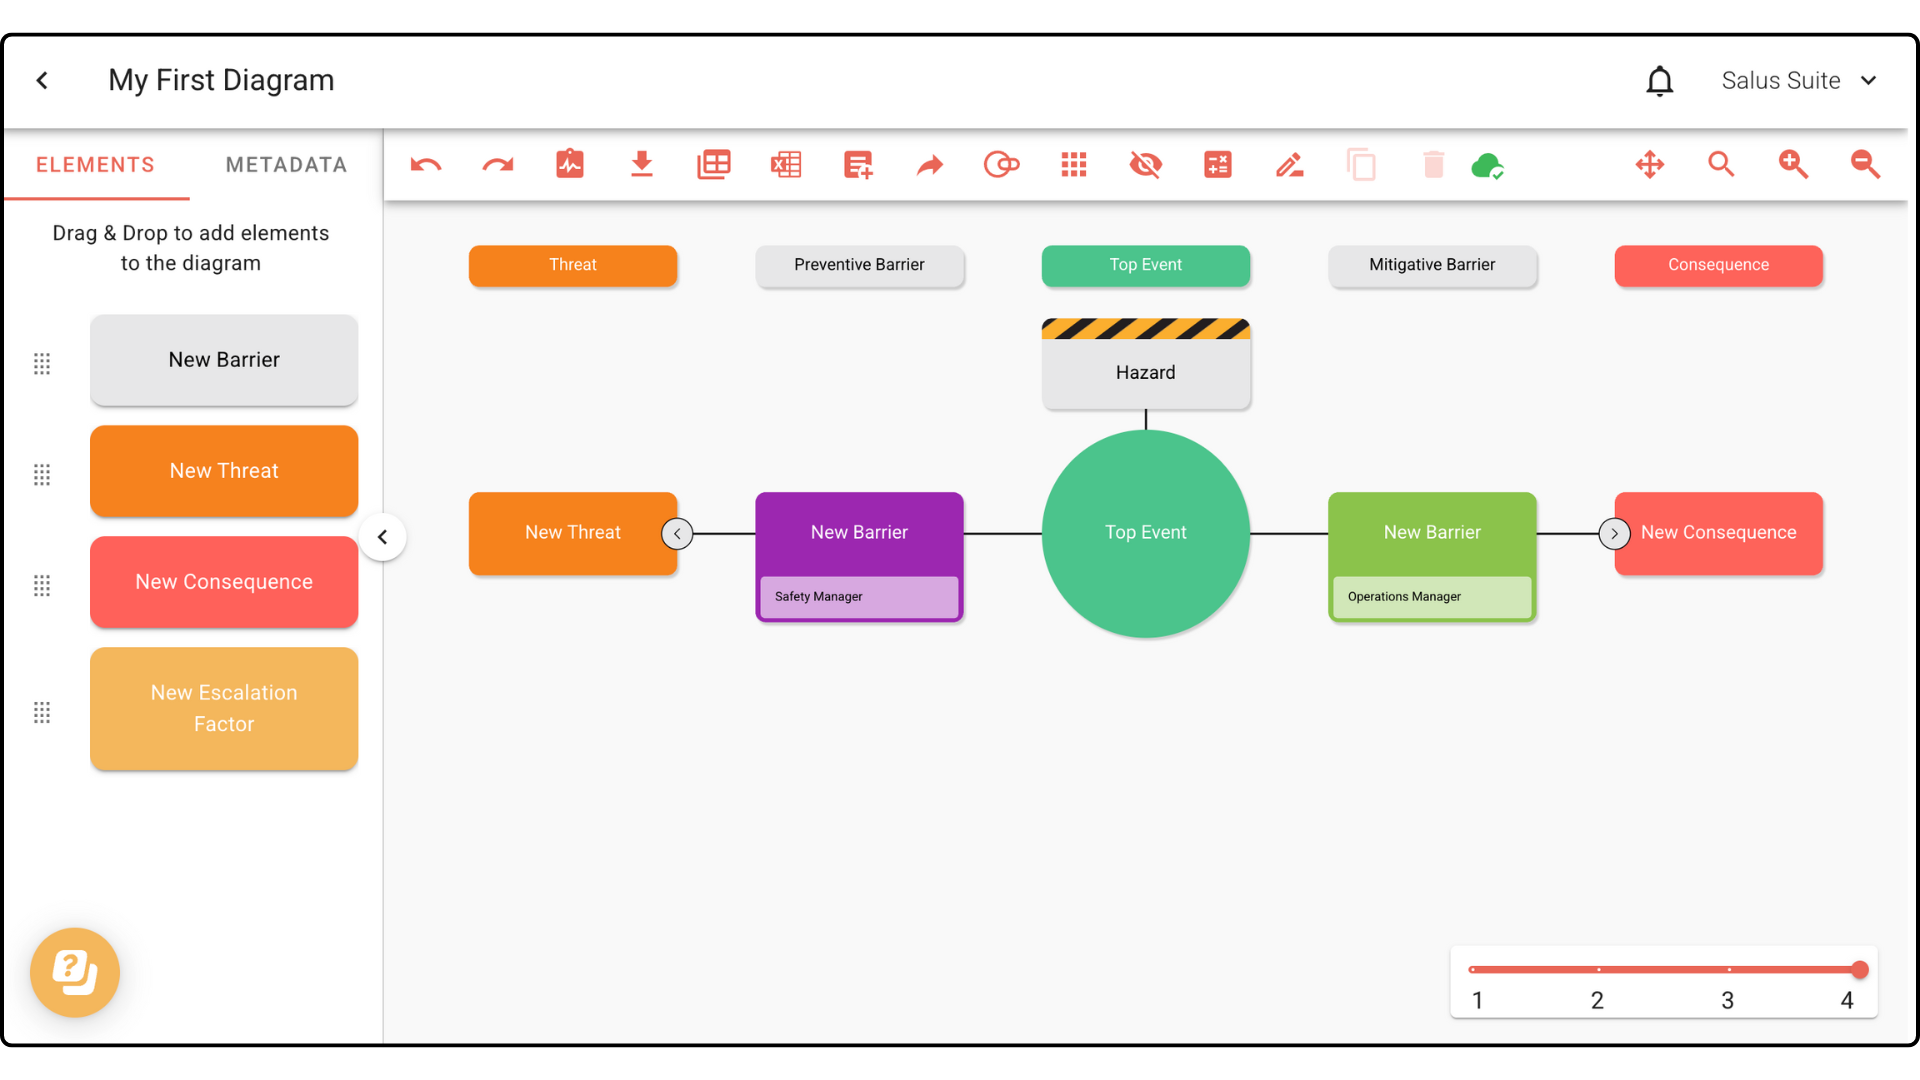
This is how your diagram will look with Analyse Mode:
Step 3: To stop analysis mode, click on Analyse button and then click Stop Analysis.


