

What is a bowtie risk assessment?
A bowtie risk assessment (also known as bowtie analysis) is a visual risk analysis method that maps the causes and consequences of a potential incident around a central ‘top event’, with preventative and mitigative barriers shown on either side — forming the shape of a bowtie. It is widely used across industries including oil and gas, aviation, mining, cyber security, and renewable energy to identify hazards, evaluate controls, and communicate risk clearly.
Bowtie Risk Assessment
A strong risk management strategy is essential to the safe and effective operations of any organisation. Risk management involves identifying potential hazards that could lead to an incident and implementing measures to mitigate the potential consequences. An important aspect of risk management is a risk assessment.
There are tools available to help guide risk assessments and prompt critical thinking. Consider conducting a bowtie risk assessment. Bowtie diagrams are a unique visual representation of potential risks and the barriers in place to control them. In this blog, we discuss the significance of bowtie diagrams in risk management and the essential elements that make up a well-constructed bowtie diagram.
Origins of Bowtie Diagrams
Did you know that bowtie diagrams originated in the aviation industry? Bowtie risk assessments were created to assist personnel in visualising complex interactions between various elements that could lead to unwanted incidents, much like what they continue to be used for. Today, bowtie diagrams have taken off far beyond the aviation industry, used regularly in Oil and Gas, Cyber Security, Mining, Renewable Energies and more.
Bowtie Analysis vs Bowtie Risk Assessment: What’s the Difference?
How to Conduct a Bowtie Risk Assessment
The seven elements are the parts of a bowtie. Building one means putting them together in order. The steps below use a single road safety example so you can follow how each one connects to the next.
- Define the hazard. Start with the source of potential harm, something inherent to your operation that has to be controlled. Keep it specific. In our example, the hazard is “driving a car”.
- Identify the top event. This is the precise moment control over the hazard is lost, before any harm has occurred. Describe the moment control goes, not the outcome: “loss of control of the vehicle”, not “car crash”.
- Map the threats. On the left of the diagram, list what could cause the top event. Each threat must be able to cause it on its own. Be specific: “poor road conditions” rather than “external factors”.
- Map the consequences. On the right, describe what could happen if the top event occurs. Name real events, not categories: “collision with another vehicle”.
- Add preventative barriers. Between each threat and the top event, place the controls that stop it happening: “brakes”, “defensive driving techniques”.
- Add mitigative barriers. Between the top event and each consequence, place the controls that limit the harm: “airbags”, “seatbelts”.
- Add escalation factors, then review. Identify what could weaken a barrier, such as “not wearing a seatbelt”, and attach a control to it, such as a “seatbelt alarm”. Then review every barrier for owner, status and last-verified date, so the assessment stays live instead of becoming a one-off document.
The 7 Essential Elements of a Bowtie Diagram
A well-constructed bowtie diagram consists of 7 key elements. Understanding these elements is essential for creating an effective representation of risk. Let’s take a closer look at each element and how they fit into a bowtie risk assessment.
1. Hazard
The hazard is the starting point of the bowtie diagram. It represents a source of potential harm, whether it be an operation, activity, or material. It is something that needs to be contained or carefully handled, so that it does not lead to a loss of control.
For instance, in the context of road safety, the hazard could be “driving a car”.

2. Top Event
The top event is the pivotal point in the bowtie diagram. It’s the moment when control over the hazard is lost, but adverse consequences have not yet occurred. The top event represents the ‘knot’ of our bowtie diagram, and all elements revolve around preventing its occurrence or mitigating the effects once it had occurred.
Using our road safety example, the top event would be “loss of control of the vehicle”.

A common mistake that is often made when creating a bowtie diagram is that the top event actually depicts a consequence, for example “car crash” rather than “loss of control of the car”. Remember, nothing bad has happened at this point. We still have time to mitigate the impacts of the loss of control.
3. Consequence
Consequences represent the undesirable outcomes that could result from the top event. These can range from environmental damage to injuries, damaged reputation, or even loss of life. Identifying and understanding potential consequences is crucial for effective risk management. Measure the severity of each consequence by using a standard or custom risk matrix.
Road safety consequence: “collision with object or other vehicle”.

4. Threat
Threats are sources of harm that could lead to the top event. Threats could be the result of a failure, an external influence or operational issues. They can include system malfunctions, human errors, or external factors that increase the likelihood of the top event occurring. Any one threat must have the power to cause the top event on its own.
Road safety threat: “poor road conditions”.

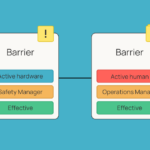
5. Mitigative Control Barrier
Mitigative barriers are controls and strategies aimed at reducing impacts of the consequences once the top event has occurred. Located on the right side of the diagram, they play a crucial role in minimising harm and facilitating effective response to the incident. We can’t always prevent an incident from occurring, but we can do our best to mitigate its consequences.
In the context of road safety, an example of a mitigative barrier would be “airbag system”, which could prevent or mitigate an injury or loss of life in the event of a crash.

6. Preventative Barrier
Preventative barriers are the measures put in place to prevent the top event from occurring, located on the left side of the diagram. These can include safety features, protocols and training programs designed to maintain control over the hazard. If the preventative barriers work as intended, the mitigative barriers do not need to be deployed, and all consequences can be avoided.
Road safety preventative barrier: “brakes” or “defensive driving techniques”.

Some barriers could appear in multiple areas on a bowtie diagram. For example, “defensive driving techniques” could both prevent a driver from losing control of the vehicle, and mitigate the consequences if they do lose control. In this instance, the barrier can be defined as both a preventative and mitigative barrier.
7. Degradation Factor
Degradation factors, also known as escalation factors, are conditions or situations that can compromise the effectiveness of barriers. They should be used sparingly and represent only the most significant threats to barrier integrity. Degradation factors differ from threats in that they are attached to a specific barrier.
For example, in road safety, “not wearing a seatbelt” could be an escalation factor that would lead to the failure of the barrier “wearing a seatbelt”.

Bonus: Degradation Controls
Just as there are barriers to threats and consequences, there are also barriers specifically designed to address degradation factors (otherwise called escalation factors). These are measures put in place to counteract the conditions that might lead to the failure of existing barriers. Each degradation factor should be equipped with a barrier to reduce the chances of the associated barrier failing.
Building off the above example, a degradation factor barrier could be “seatbelt alarm” that encourages the driver and passengers to wear their seatbelt.
When to Use a Bowtie Risk Assessment
A bowtie is not the right tool for every risk. Knowing when to reach for it keeps your risk register focused. Use a bowtie risk assessment when:
- You are dealing with high-consequence, low-frequency events: major accidents and process safety scenarios where a single failure matters.
- You need to communicate risk to a non-technical audience. The visual format makes the link between causes, controls and consequences clear at a glance.
- Your existing risk register feels static and doesn’t show how controls relate to the risks they manage.
- A regulatory framework calls for barrier-based risk management, such as COMAH, SEVESO, or demonstrating that risk is ALARP (as low as reasonably practicable).
The method is standard practice in oil and gas, aviation, rail, mining, maritime, cyber security and utilities.
When not to use it. For low-consequence, routine operational risks, a bowtie is overkill. A simple likelihood-versus-severity risk matrix captures what you need without the extra effort.
Bowtie Risk Assessment vs Other Methods
The bowtie works alongside other risk assessment techniques rather than replacing them. The table below shows where it fits against the methods it is most often confused with.
| Comparison | Where the bowtie fits |
|---|---|
| Bowtie vs HAZOP | They work together. A HAZOP is a systematic, deviation-by-deviation study of a process; a bowtie is a visual, barrier-focused view of a single hazard. Many teams run a HAZOP first, then build bowties for the major hazards it surfaces. |
| Bowtie vs Fault Tree | A fault tree is quantitative and models only the causes of an event. A bowtie is qualitative or semi-quantitative, and shows both causes and consequences in one diagram. |
| Bowtie vs Risk Matrix | A risk matrix gives you a likelihood-and-severity score. A bowtie shows why that score exists and what holds it in place. Use the matrix to prioritise risks and the bowtie to manage them. |
| Bowtie vs LOPA | Layers of Protection Analysis quantifies how effective your barriers are, and layers onto a bowtie. See how to enhance your bowtie with LOPA. |
Conclusion
A Bowtie sotware is a powerful risk management tool that offers a complete view of potential threats and consequences and the measures in place to prevent an incident or mitigate its consequences. When conducting a bowtie risk assessment, it’s important to remember that barriers are a central aspect of bowtie diagrams, but they are just one part of the overall picture. Each element contributes to the overall picture of your risk and should be constructed with this in mind.
When creating a bowtie diagram, clear, concise wording of each element and attention to detail are essential. It’s not just about identifying the elements but also about depicting their relationships to other elements of the bowtie diagram accurately. By implementing an effective bowtie risk assessment into your regular risk management strategy, professionals can better visualise and manage risks, creating a more robust risk management system and overall safer organisation.
Have a question or want to chat about Bowtie Master? Get in touch at support@salus-suite.com.
This blog was written with references from the Energy Institute’s book, Bow Ties in Risk Management (2018).
Frequently Asked Questions
Common questions about the bowtie risk assessment method.