
Risk assessments are a standard and necessary element of risk management, allowing decision makers to minimise, monitor and control their risks. Risk assessments ensure that organisations are prepared for potential incidents by identifying hazards and then eliminating or reducing the risk of each hazard by implementing control measures.
Like a good story, risk assessments have a beginning, middle and end. First, identify your hazards. Then, you must decide what consequences could arise from the hazard. And finally, you must determine what controls you have in place to prevent the hazard or mitigate the risk.
Where can you find all three components of a risk assessment, tied up into a neat bow(tie)? In a bowtie diagram!
The Role of Bowtie Diagrams in Risk Assessments
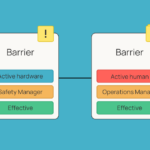
A great tool to have in your risk assessment toolbox is the bowtie method. Increasing in popularity, bowtie diagrams are a qualitative risk assessment method that help you visualise, understand and communicate your risk. Their two-sided structure shows how threats can lead to losing control of a hazard and cause this incident to develop into a number of undesired consequences.* A bowtie diagram is known as a barrier-based risk assessment, because a major focus of the bowtie method is understanding what barriers are in place to prevent an incident or mitigate its consequences.
By pinpointing the controls you have in place to stop or lessen the effects of an event, organisations can understand where to prioritise their risk management efforts. Bowtie diagrams are an excellent jumping-off point to assess the effectiveness of these barriers and begin managing them.
But how do you create a bowtie diagram? Surely there’s a better way than drawing one up on the chalkboard, or putting your Excel skills to the test. And there is: Bowtie Master.
Why Bowtie Master?
Bowtie Master is the number one most effective solution for building bowtie diagrams. Our Bowtie Risk Software is equipped with handy features and resources that will make building a bowtie diagram as easy as possible, whether it’s your first or one-hundred-and-first.
Keep reading to find out what sets Bowtie Master apart from other risk assessment software.
-
Easy to use
We strive to create the best user experience possible. Bowtie Master is easy to use for all levels of bowtie diagram creators/viewers. Our Bowtie Risk Software is web-based, meaning you can access it whenever, wherever, and with unlimited users. With autosave, never worry whether your work has been saved. Pick up where you left off during your last session, whether it be tomorrow or next week.

And building bowtie diagrams couldn’t be easier with drag and drop. Drag threats, consequences and barriers to their desired location, and clone and sync elements for extra ease.
-
Collaboration
Bring unlimited users in to collaborate on projects and decide their level of access, from an Organisation Admin to a Diagram Viewer. You can also share your bowtie diagrams with external audiences via our live share link or image download feature. Embed the link into a presentation, your organisation intranet, or share with anyone.
-
Customisation
No two organisations look at risk management the same way. That’s why our software is totally customisable to your organisation’s specific needs. Decide which metadata is most important to each individual bowtie diagram, or across your whole organisation. Create custom metadata drop-down lists, use free text and even change the colour of each option.
Do you say ‘threats’ or ‘causes’? ‘Escalation factors’ or ‘degradation factors’? Whatever your preference, you can change your terminology settings to suit your needs. You can even upload your company’s logo for an extra bit of personalisation!
-
Dashboard

Zoom out to visualise your cumulative risk. Our handy Dashboard feature allows you to compare and contrast metadata across bowtie diagrams, visualising the effectiveness of your barriers, owners, type and more. This data is displayed in easy-to-read tables and pie charts. Decide which projects or diagrams you want to analyse and which metadata you want displayed.
-
Risk Matrices
View the severity of your risks in tabular form, using the PEAR method or your organisation’s standard risk matrix. A risk matrix allows you to pinpoint exactly where you believe the consequence of an event lies, using a Likelihood axis and a Severity axis. If an event is not very severe and unlikely to occur, it would be labelled ‘AI’. But if the event is extremely severe and likely to occur, it would be given the label ‘E5’.
-
Compatibility

We’re not only compatible with our users… we’re compatible with other software! Connect with external software such as Power BI, Excel, Tableau and more. And, use our Excel features directly in your diagrams. Export to a detailed, colour coded file or simply backup your raw data.
-
Customer Service
We value our customers and aim to incorporate their suggestions. Being a Bowtie Master user means always having your questions answered and your input considered (and often implemented). Email us, book a call or submit a request through our website. We love to hear from our customers.
Have a question about Bowtie Master or bowtie diagrams in general? Our team is great, but our AI Assistant can answer your questions instantly! Ask ‘how do I add new users?’ or ‘how do I incorporate human error into a bowtie diagram?’ or anything in between!
Conclusion
Bowtie diagrams are a great tool in the toolbox to visualise your risk. Bowtie Master stands apart from the crowd as an easy-to-use, easy-to-access software that is customisable, intuitive and compatible. Bowtie Master is the most effective software solution when aiming for a more efficient and effective risk assessment strategy.
Ready to get started? Book a call with one of our experts.
*This article references information from the Energy Institute’s book, Bow Ties in Risk Management (2018).