Using Barrier condition, we can see multiple barriers on the pathway that are impaired.
This is a powerful way to visualise a major accident scenario. The barriers are colour-coded based on their effectiveness. Green means the barrier is effective, amber means that it’s partially impaired, and red means that it’s fully impaired. By using this visualisation, we can quite clearly see the whole scenario in one image, and we know where to prioritise our attention.
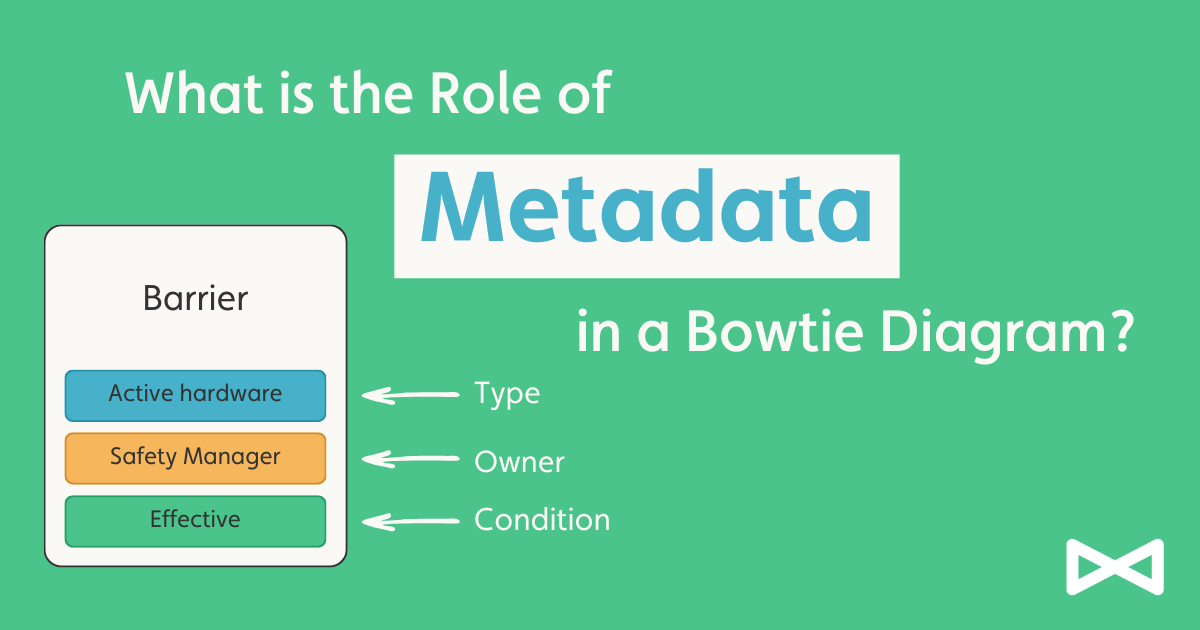
Metadata is an additional benefit of using bowtie diagrams in risk management.
It helps to identify the type of barrier and its condition. With metadata, we can keep track of the barrier’s health and ensure that it remains effective. Moreover, it provides a clear picture of the whole scenario, making it easier to make informed decisions.
Barrier effectiveness is crucial in risk management, and metadata is the key to ensuring it.
The visualisation of barrier condition provides an incredibly powerful way to identify multiple barriers on the same pathway that are impaired. By using metadata, we can prioritise our attention and ensure that barriers remain effective. Bowtie diagrams with metadata are an efficient and effective way of managing risk, making it easier to identify potential hazards, prevent accidents, and protect people, property, and the environment.
Watch the Webinar “How to Make a Bowtie Diagram” or see more information about Metadata and its use.