Enhance your bowtie diagram with LOPA
LOPA will take your bowtie diagrams to the next level by using concrete quantitative data to evaluate the effectiveness of barriers in preventing or mitigating the top event. It ensures that the risk of the top event and associated consequences is reduced to a tolerable level through sufficient and effective protection layers.
Contents
-
Editing Main LOPA Settings Visibility
-
Assigning Initiating Frequencies to Threats
-
Quantifying Likelihood of Occurrence
-
Colour Coding for Barrier Failure Rates
-
Comparing Consequences to Target Frequencies
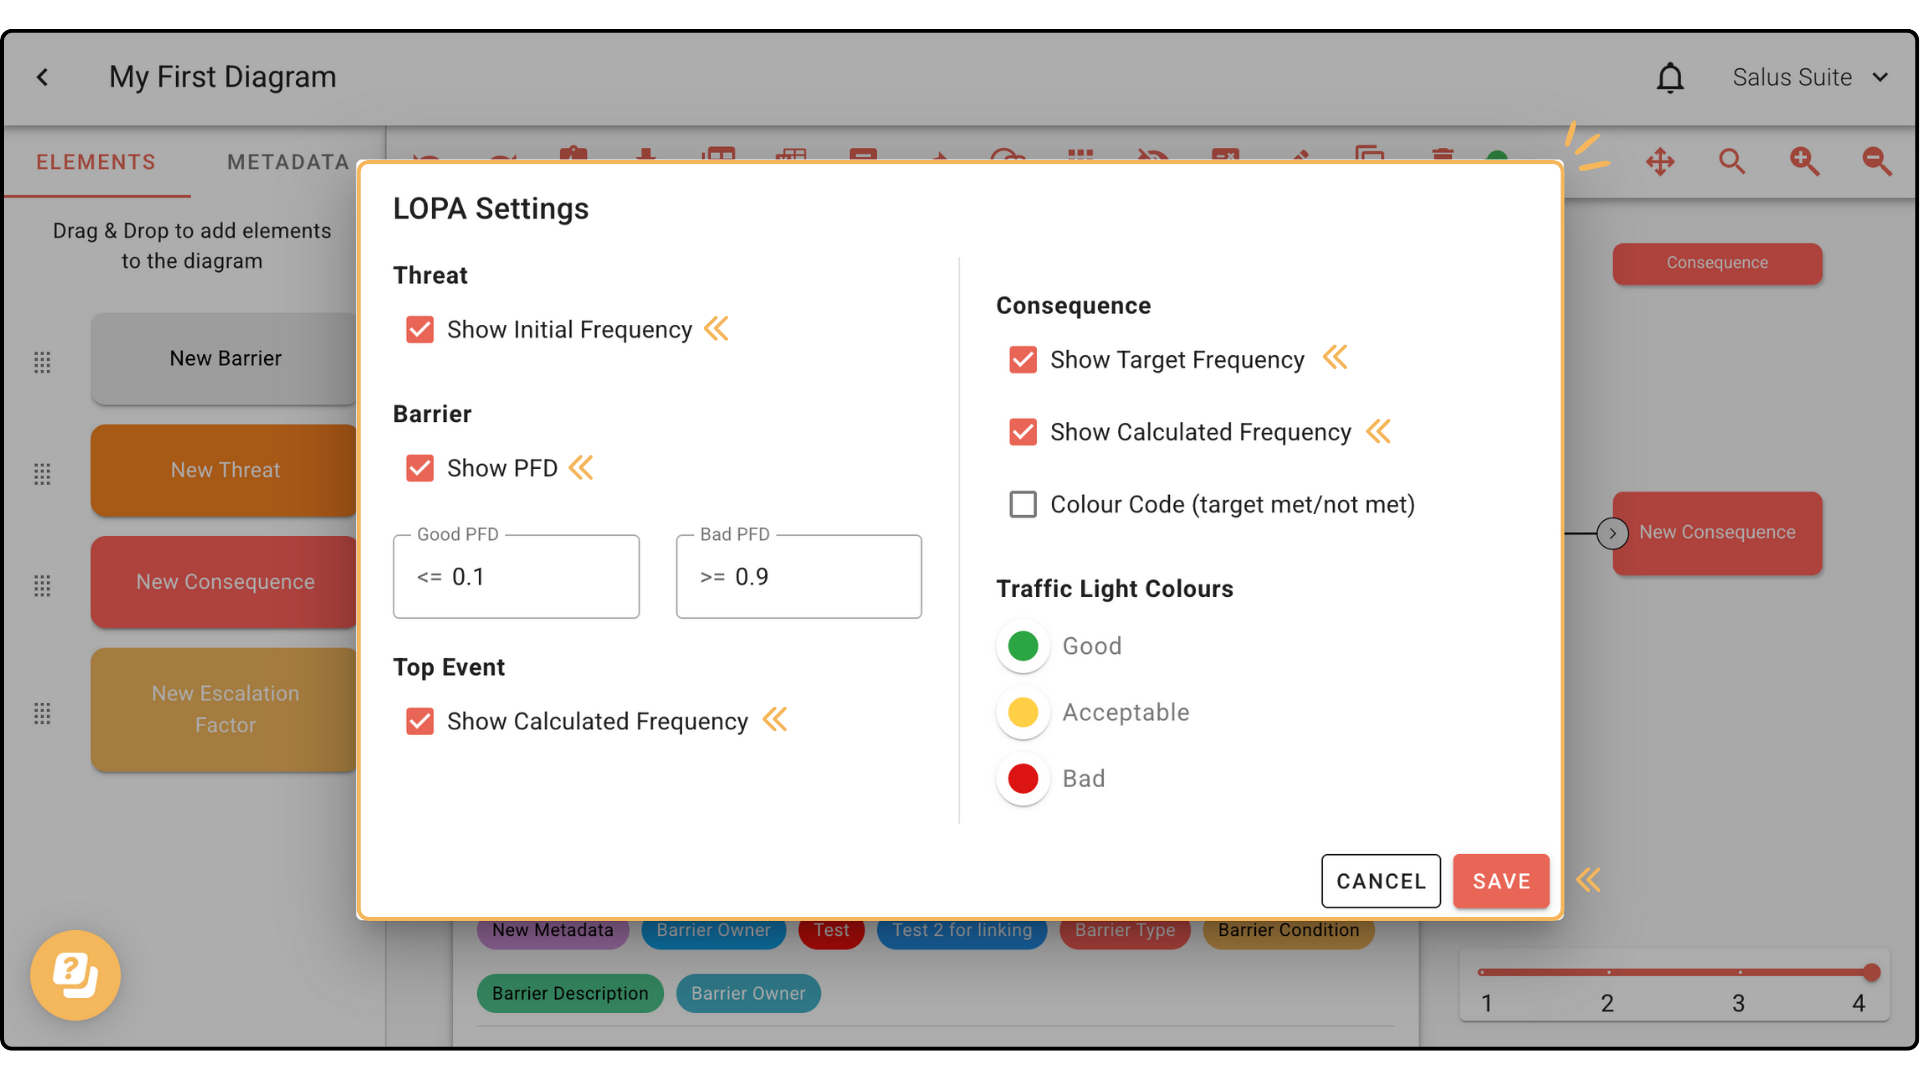
Editing Main LOPA settings visibility
Step 1: In the Diagram Editor, click on LOPA. In the drop-down menu, click Settings. 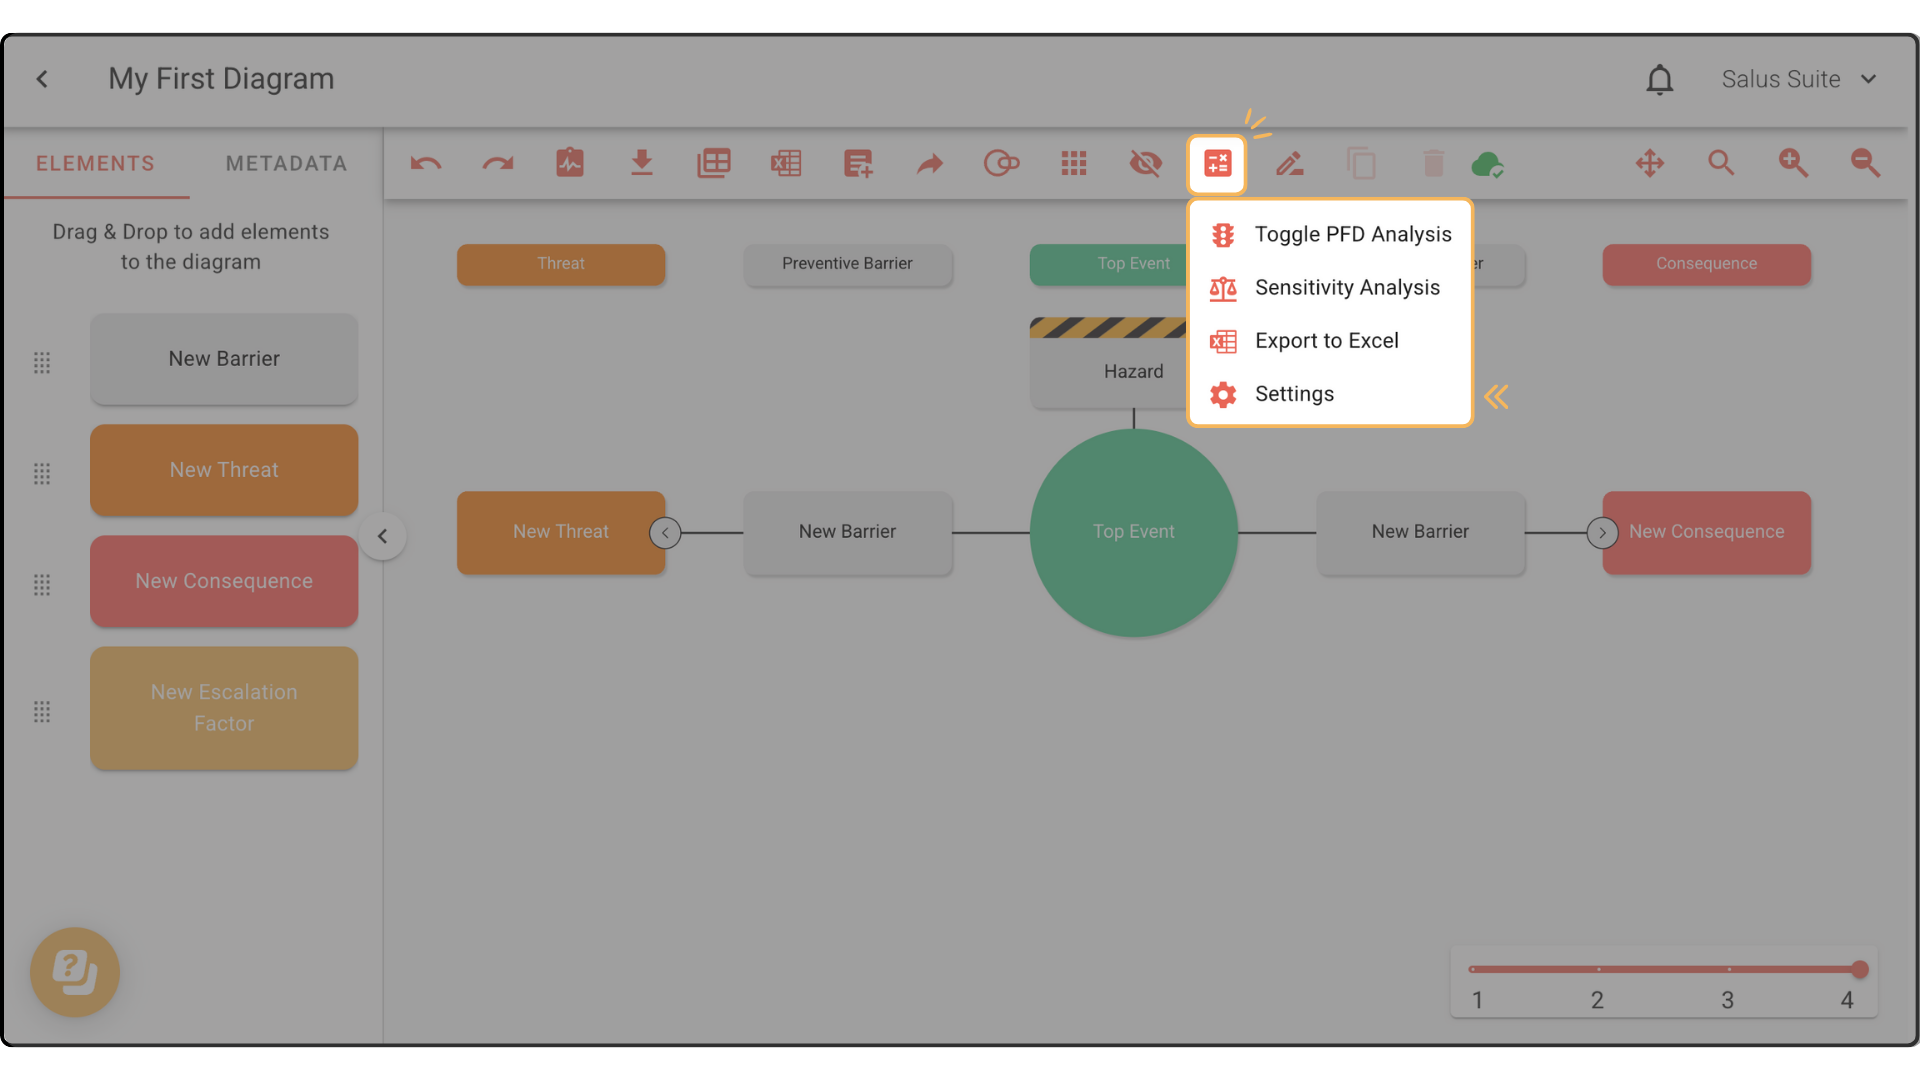
Step 2: In the LOPA Settings pop-up, you can edit the view of LOPA within your bowie diagram, showing/hiding frequency figures. Within this tab, you can also set both Good and Bad PFDs (Probability of Failure on Demand). 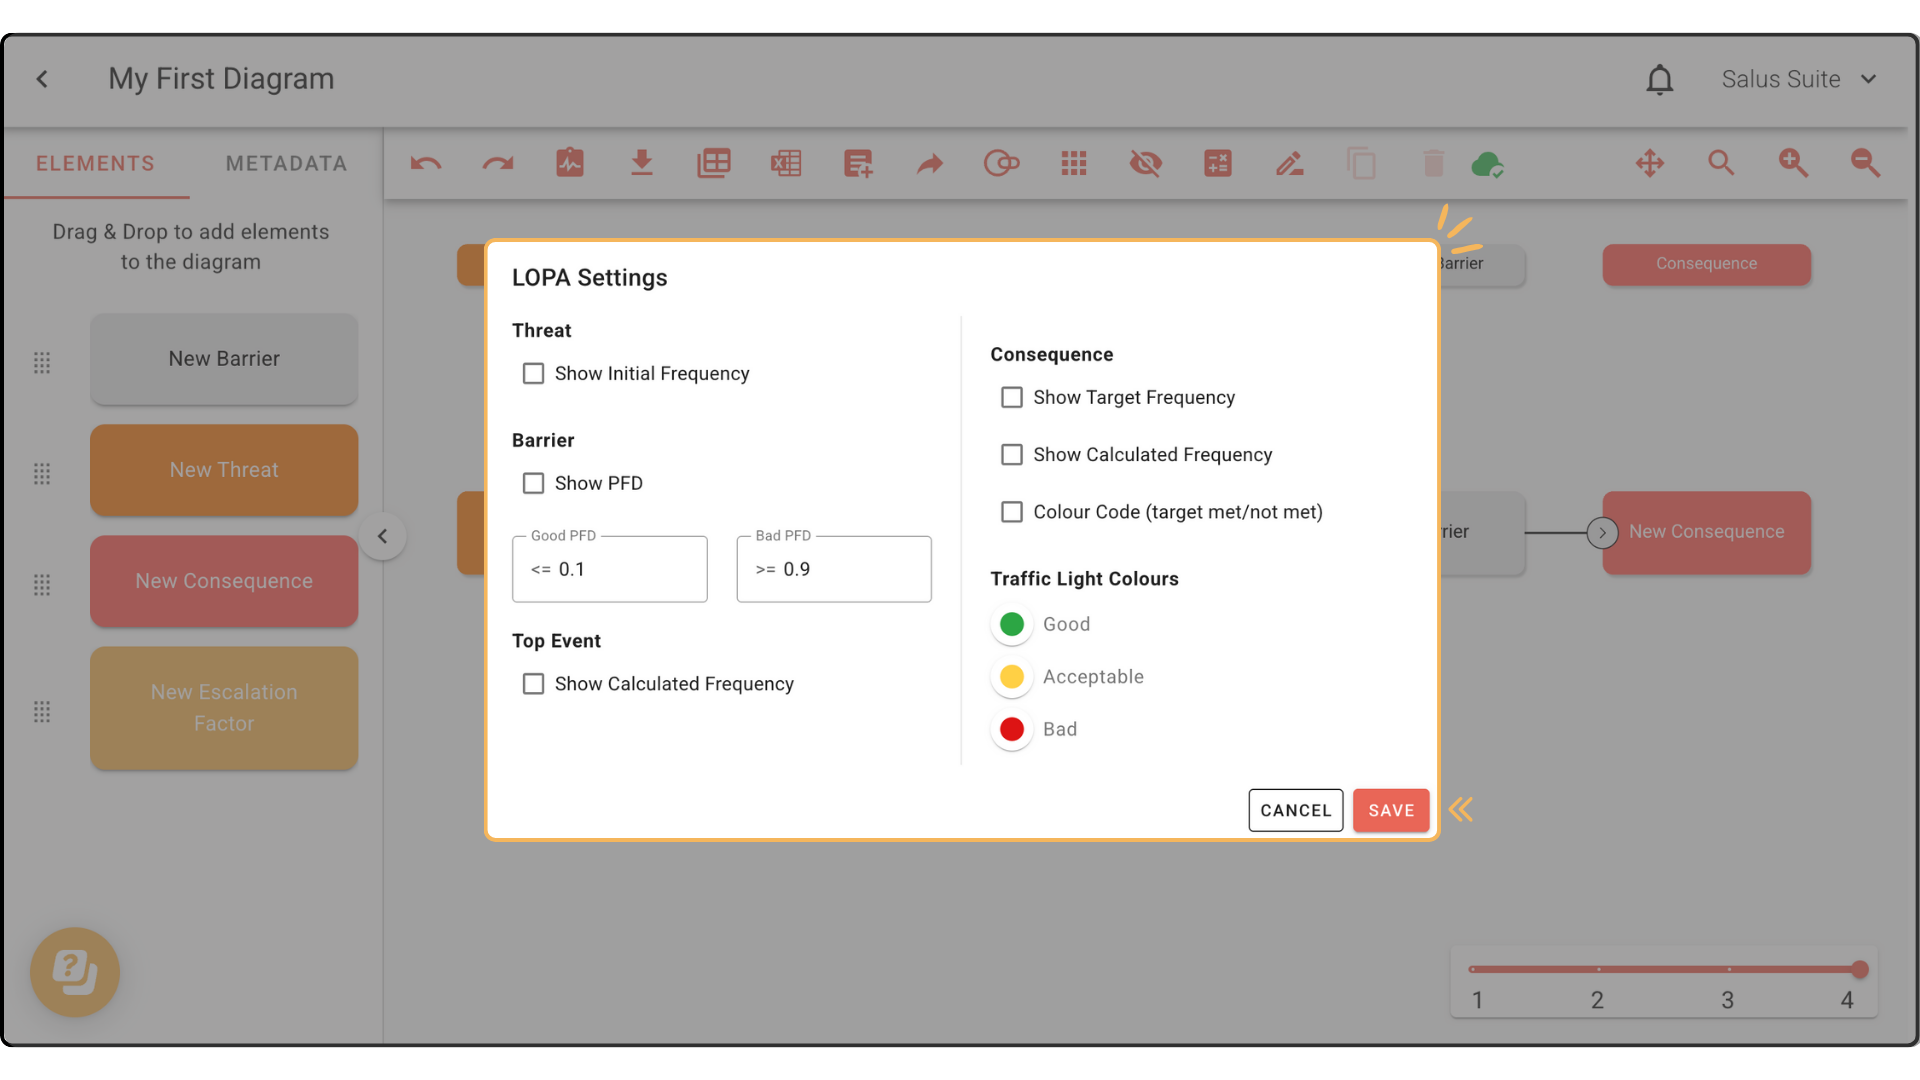
Assigning Initiating Frequencies to Threats
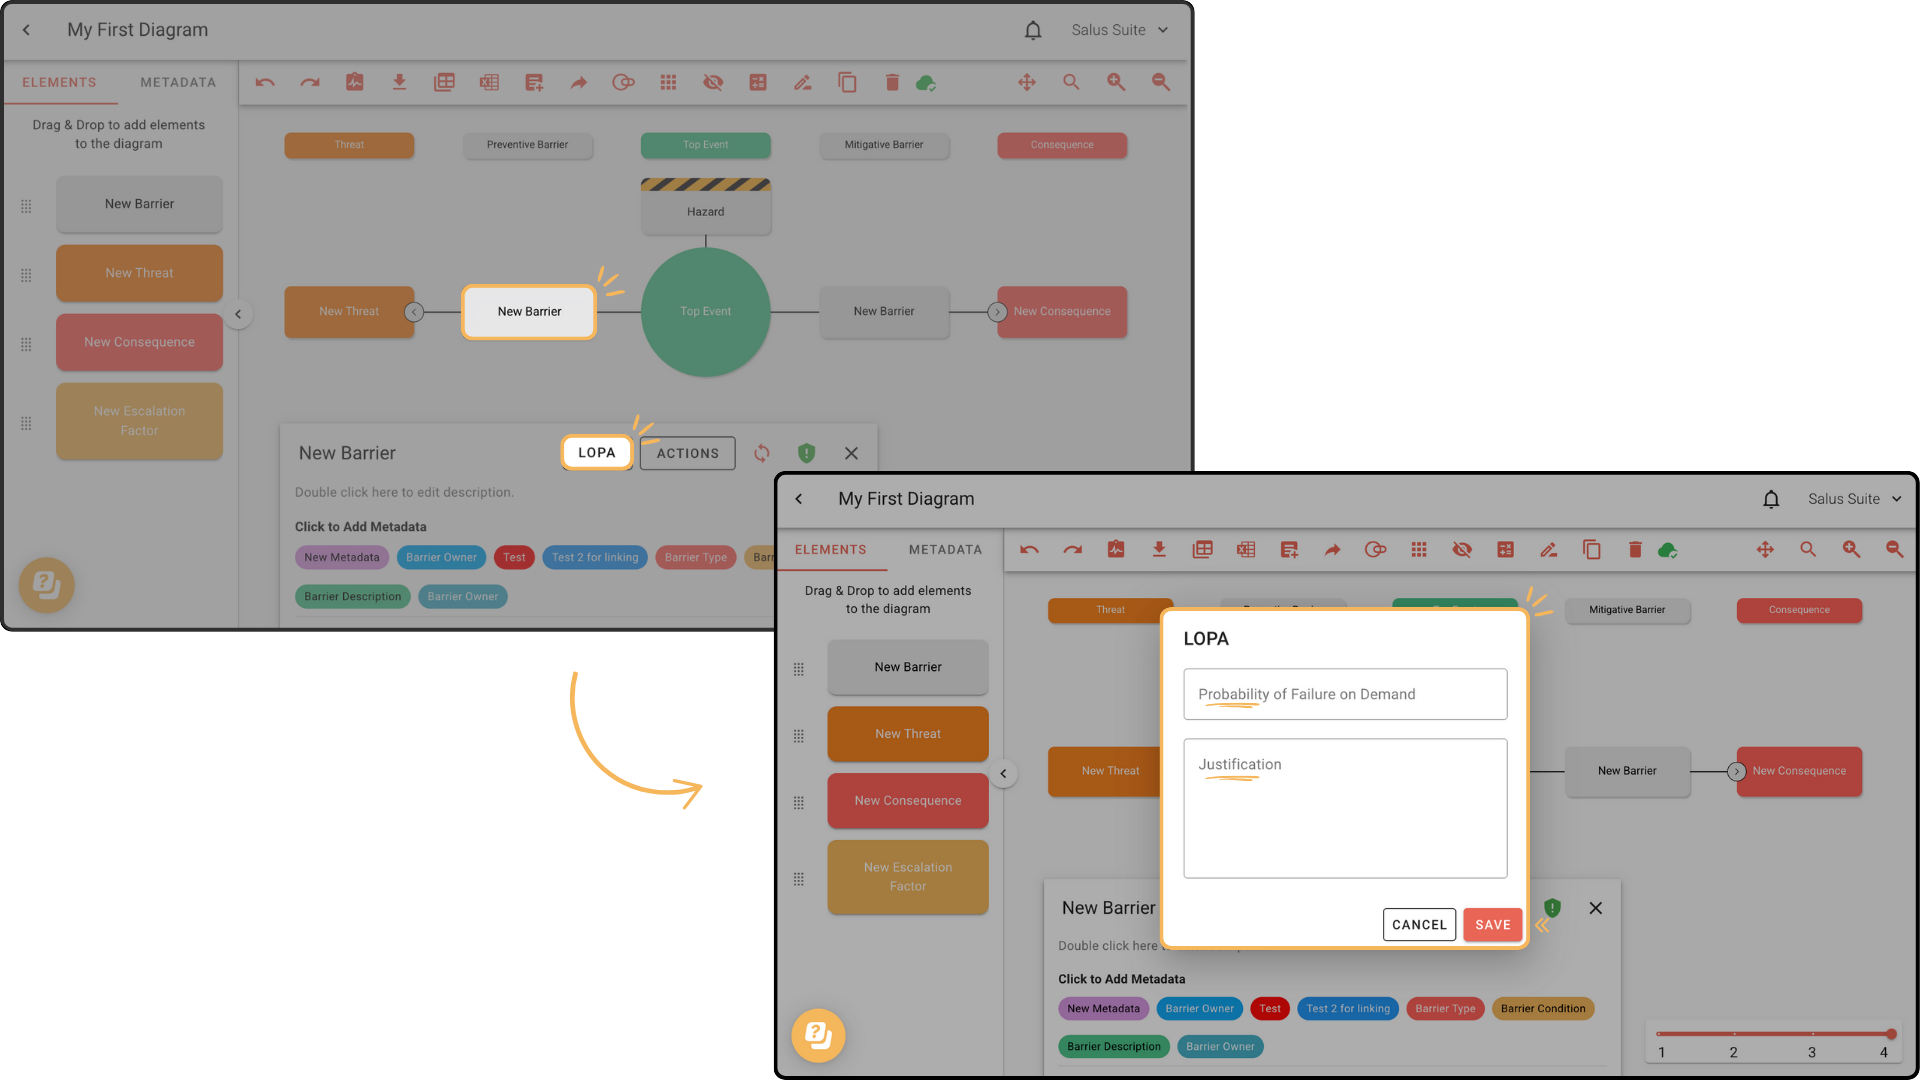
Step 1: Select the threat you would like to assign initiating frequencies to, a tab will pop up at the bottom of your diagram editor. Select LOPA. 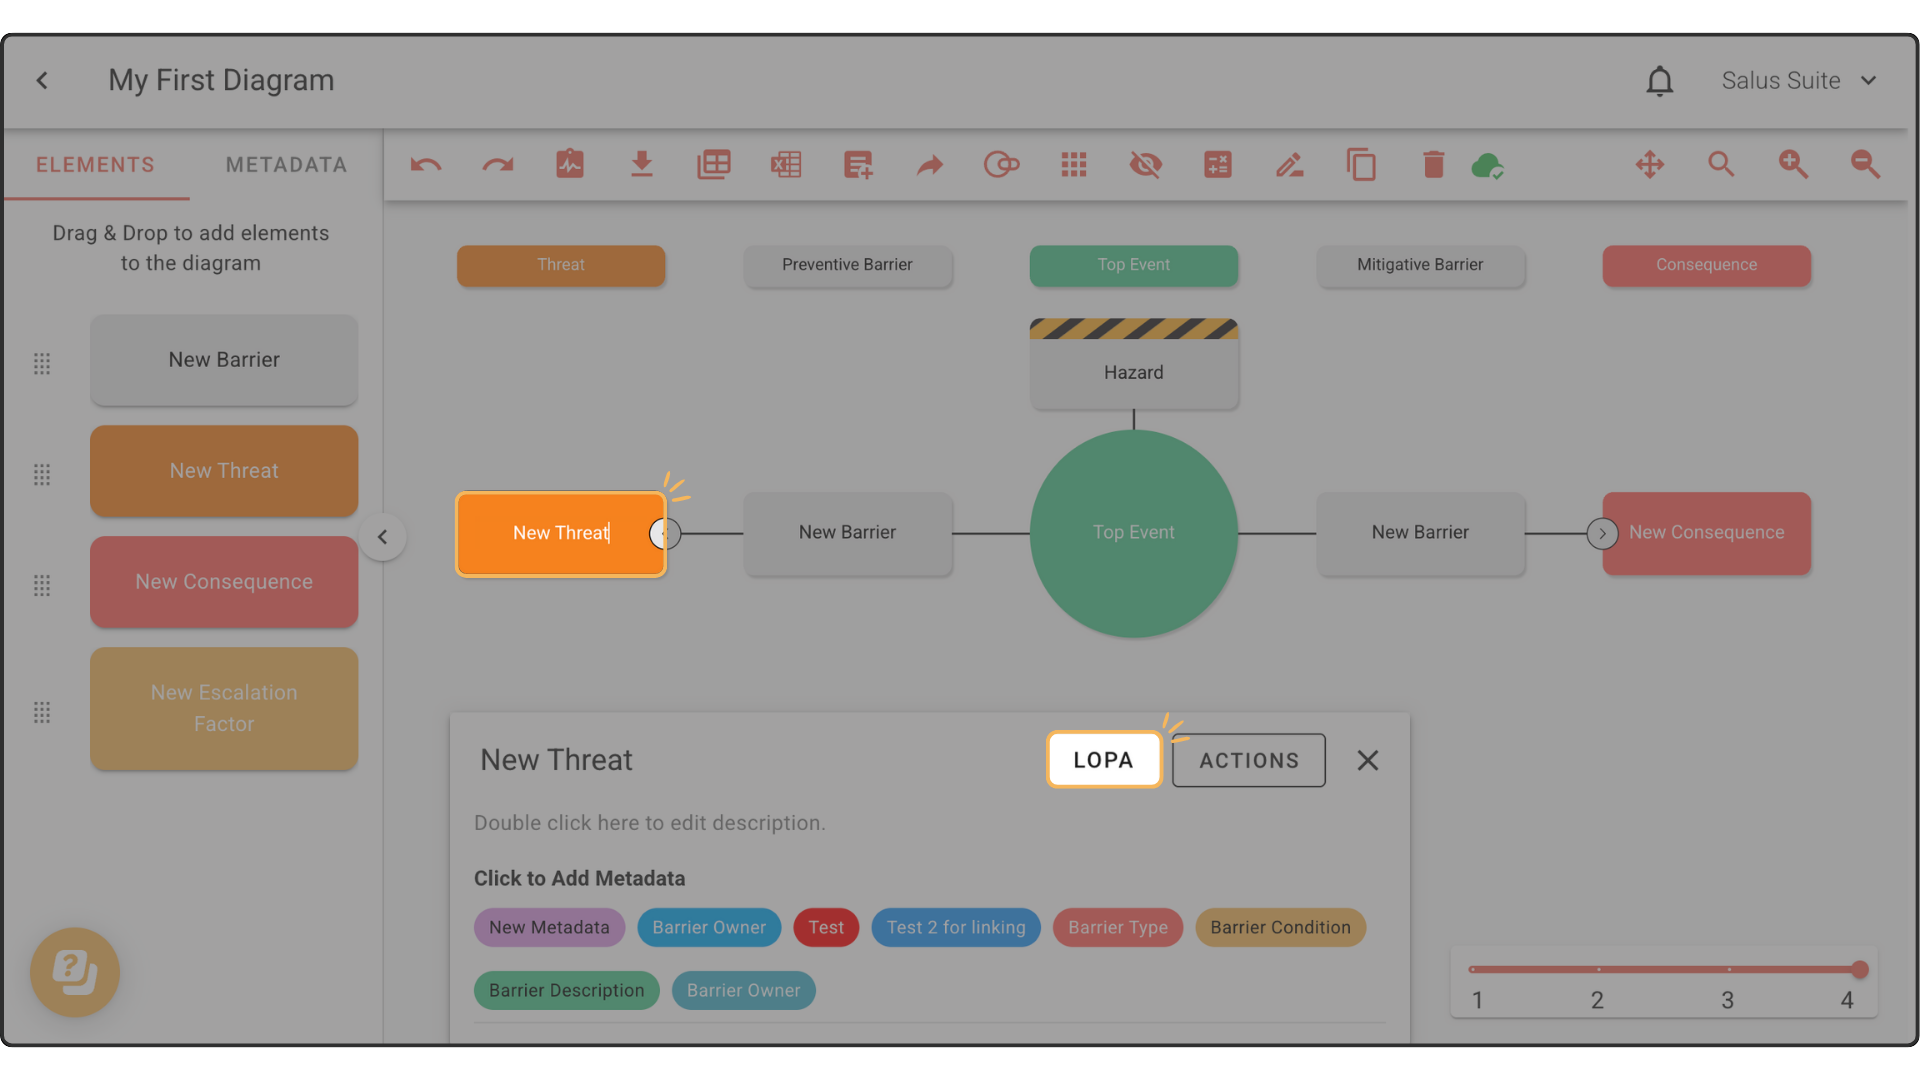
Step 2: Add the Initial Frequency and Justification. Click Save. The new value will be displayed within the element. Note: Adding Justification is optional. 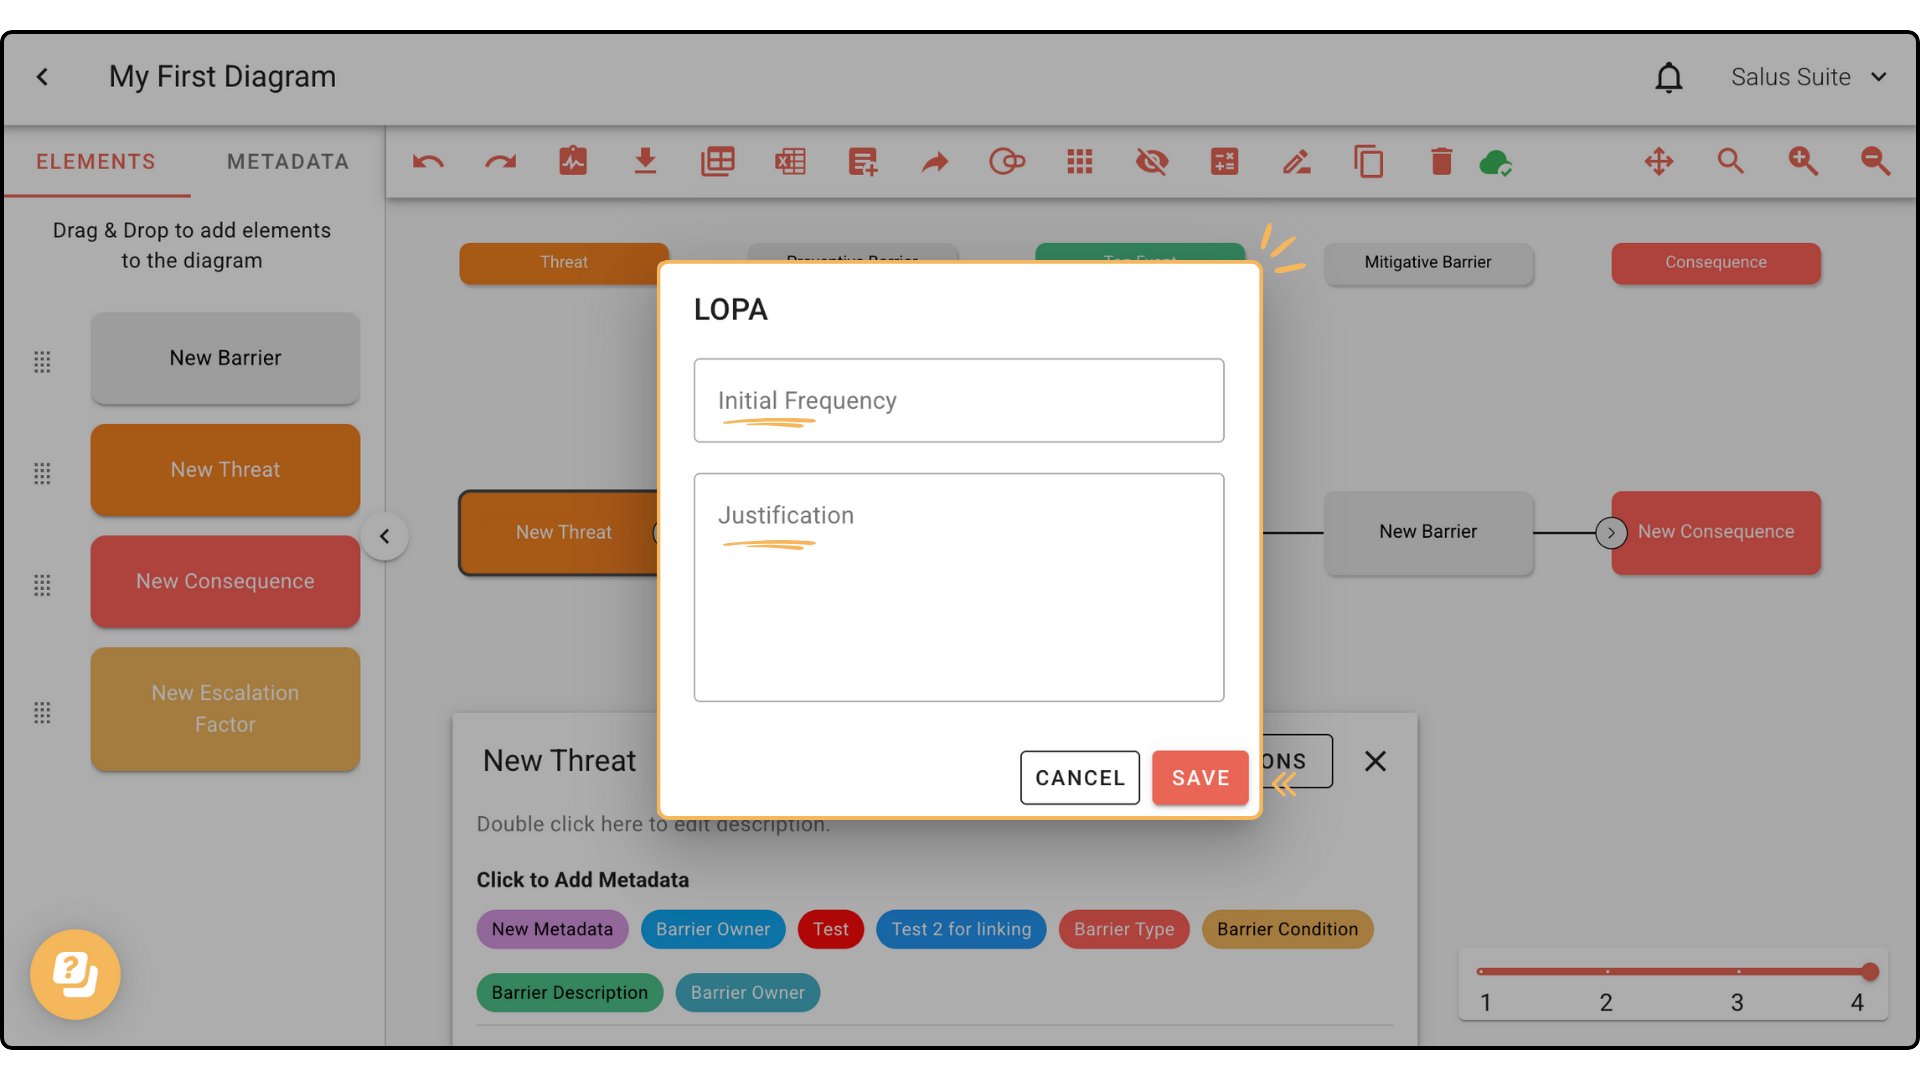
Adding PFD (Probability of Failure on Demand) to Each Barrier
Step 1: Select the barrier you would like to assign a PFD value to. A tab will pop up at the bottom of your diagram editor. Click LOPA. 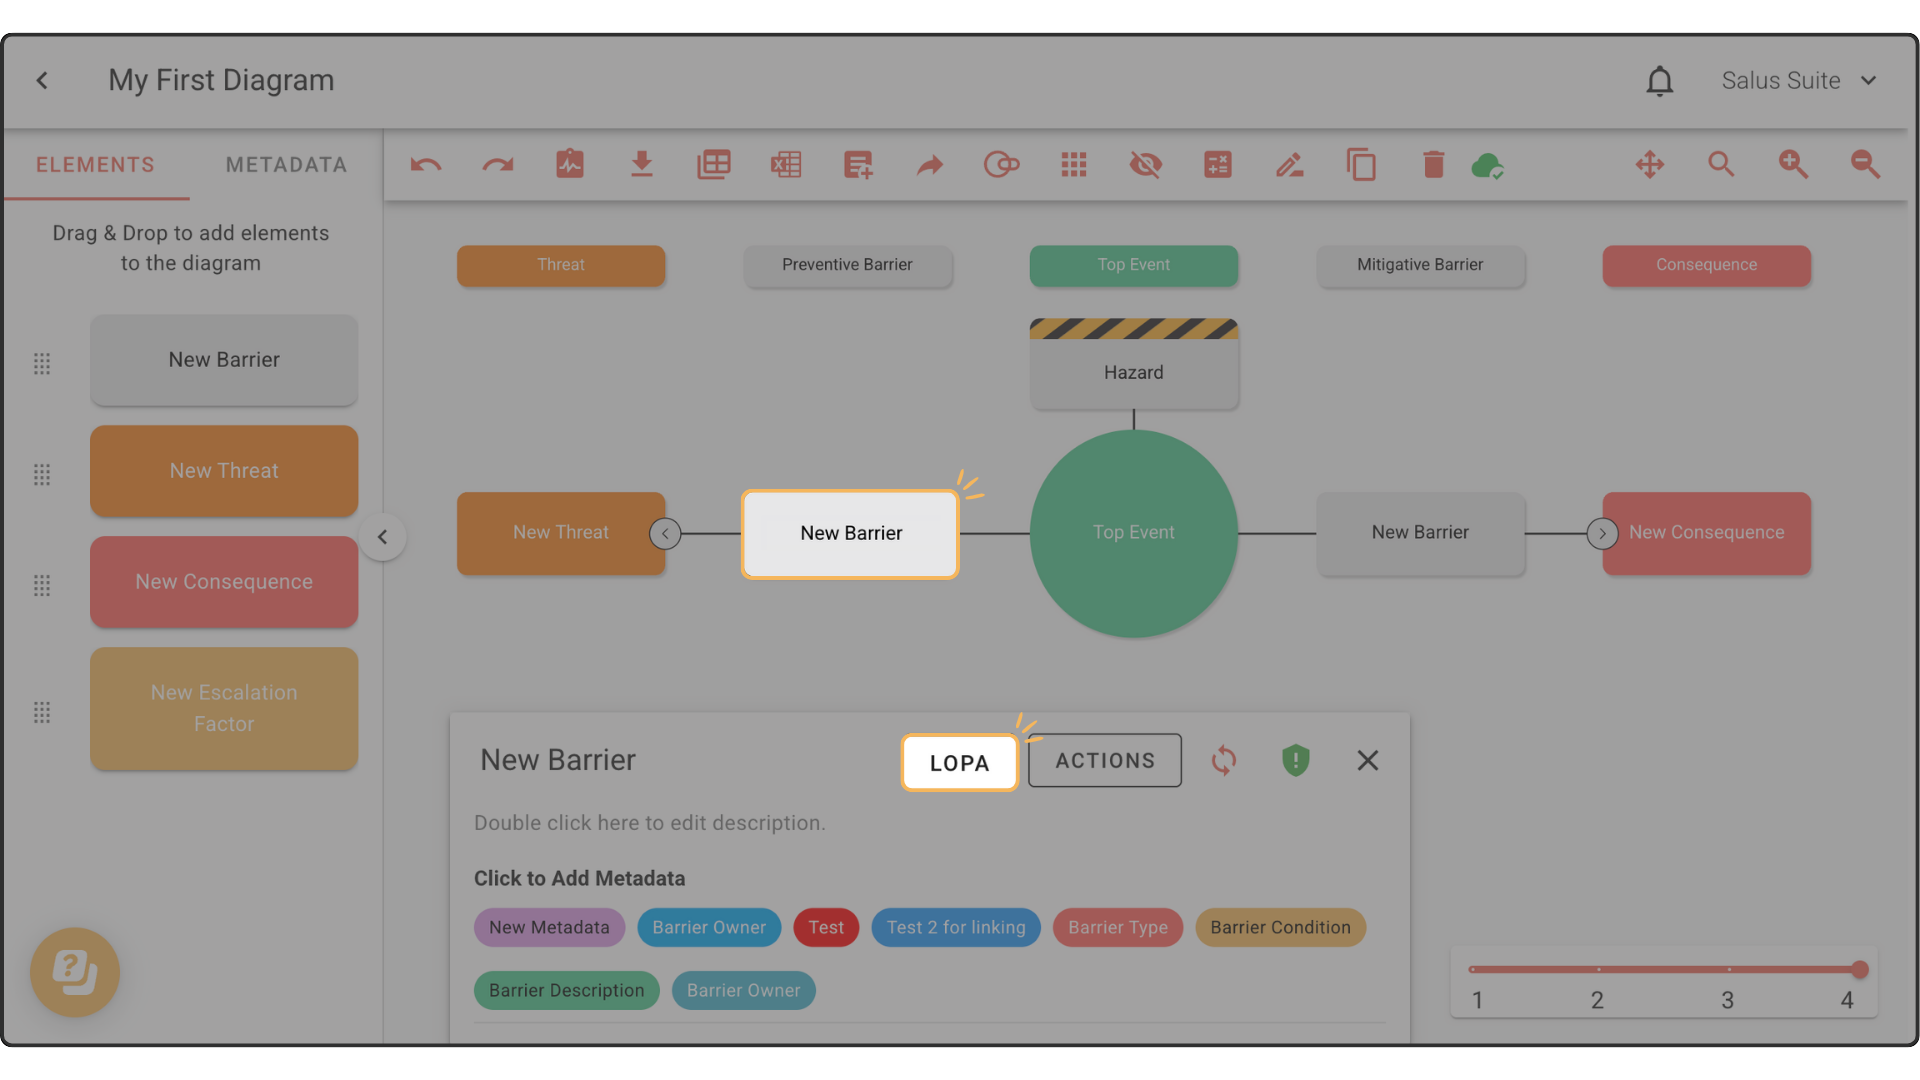
Step 2: Add the PFD (Probability of Failure on Demand) and Justification. Click Save. Note: Adding Justification is optional. 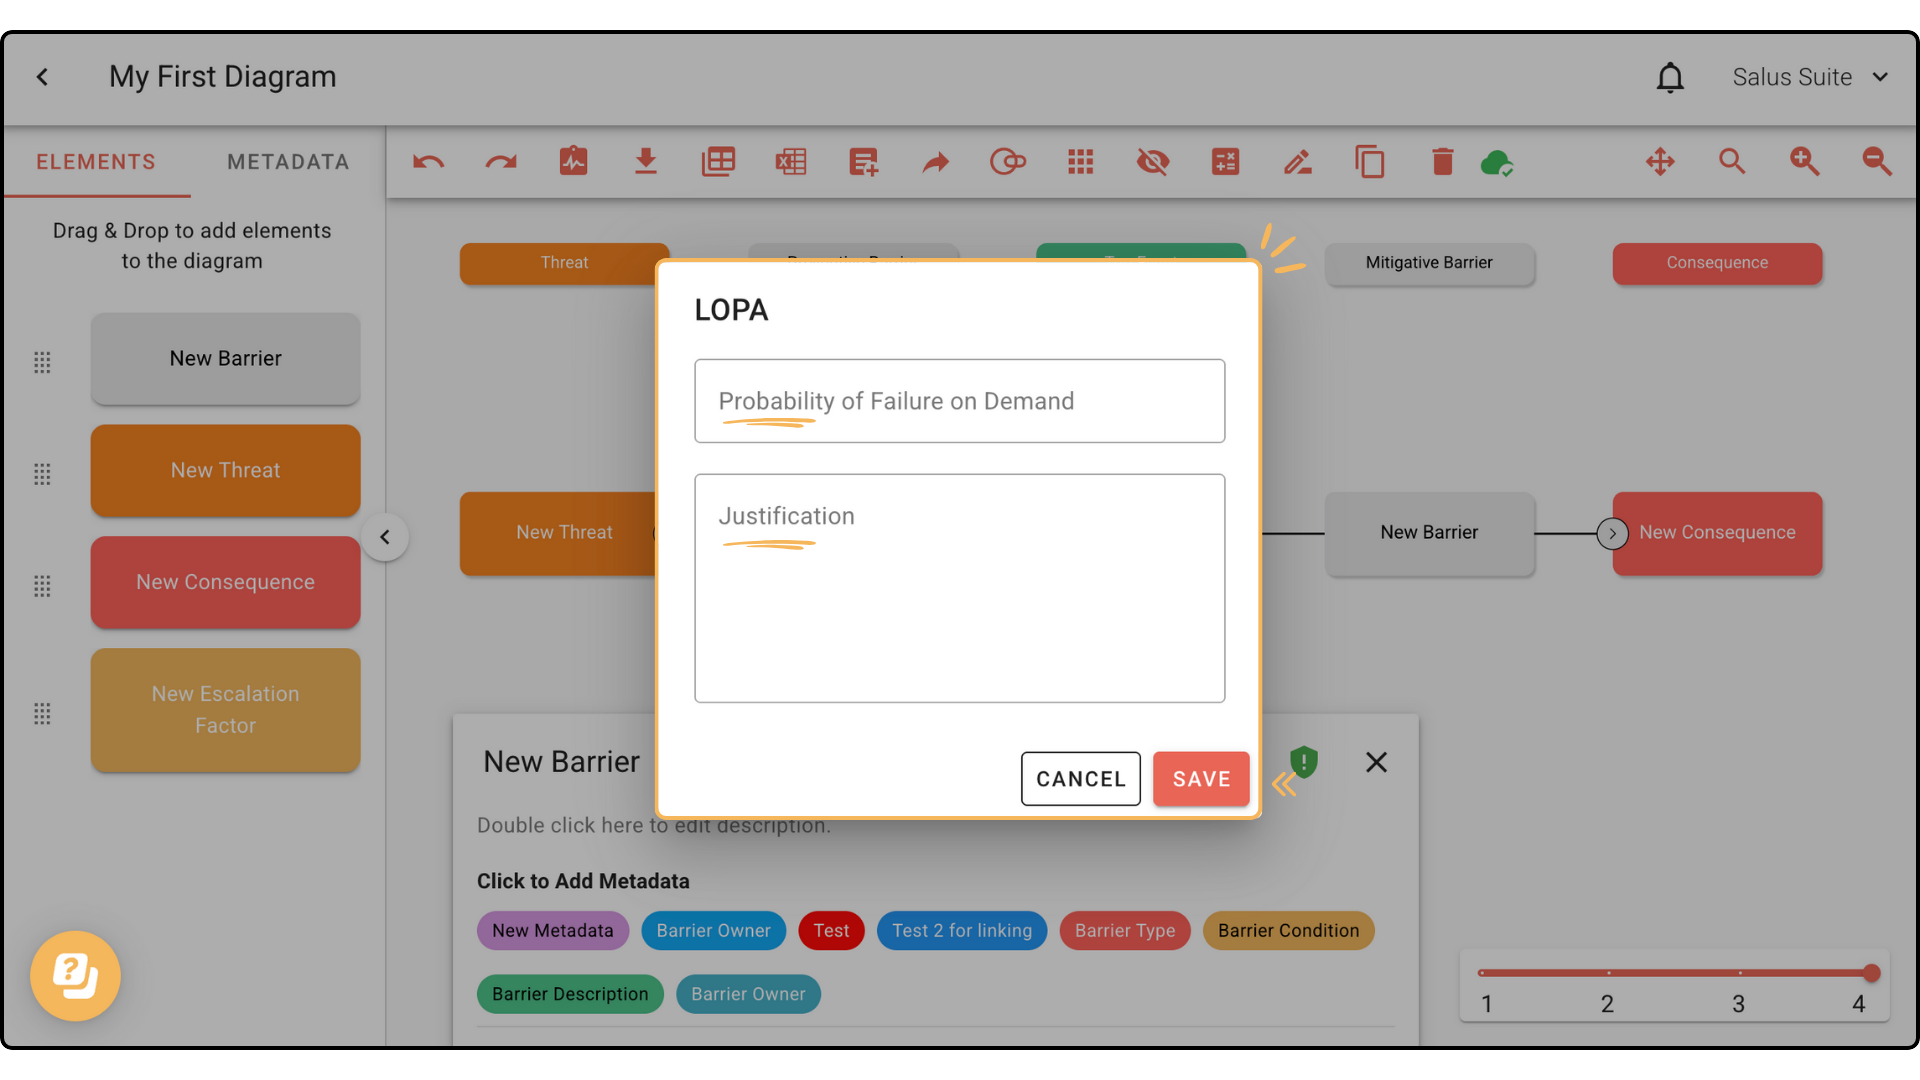
Quantifying Likelihood of Occurrence
Step 1: Click LOPA. In the drop-down menu, select Settings. 
Step 2: Set both the Good and Bad PFD values and turn on Show Frequency across all tick boxes. Click Save.
Step 3: Add your frequency value and any applicable justifications to all threats, barriers, and consequences. The frequency value needs to be added to all elements for the top event to be calculated. To add the frequency value and justification, click on an element and select LOPA.
Step 4: Once all values have been filled in, the frequency of the top event occurring will be calculated, and the green rectangle below the top event will display a value. 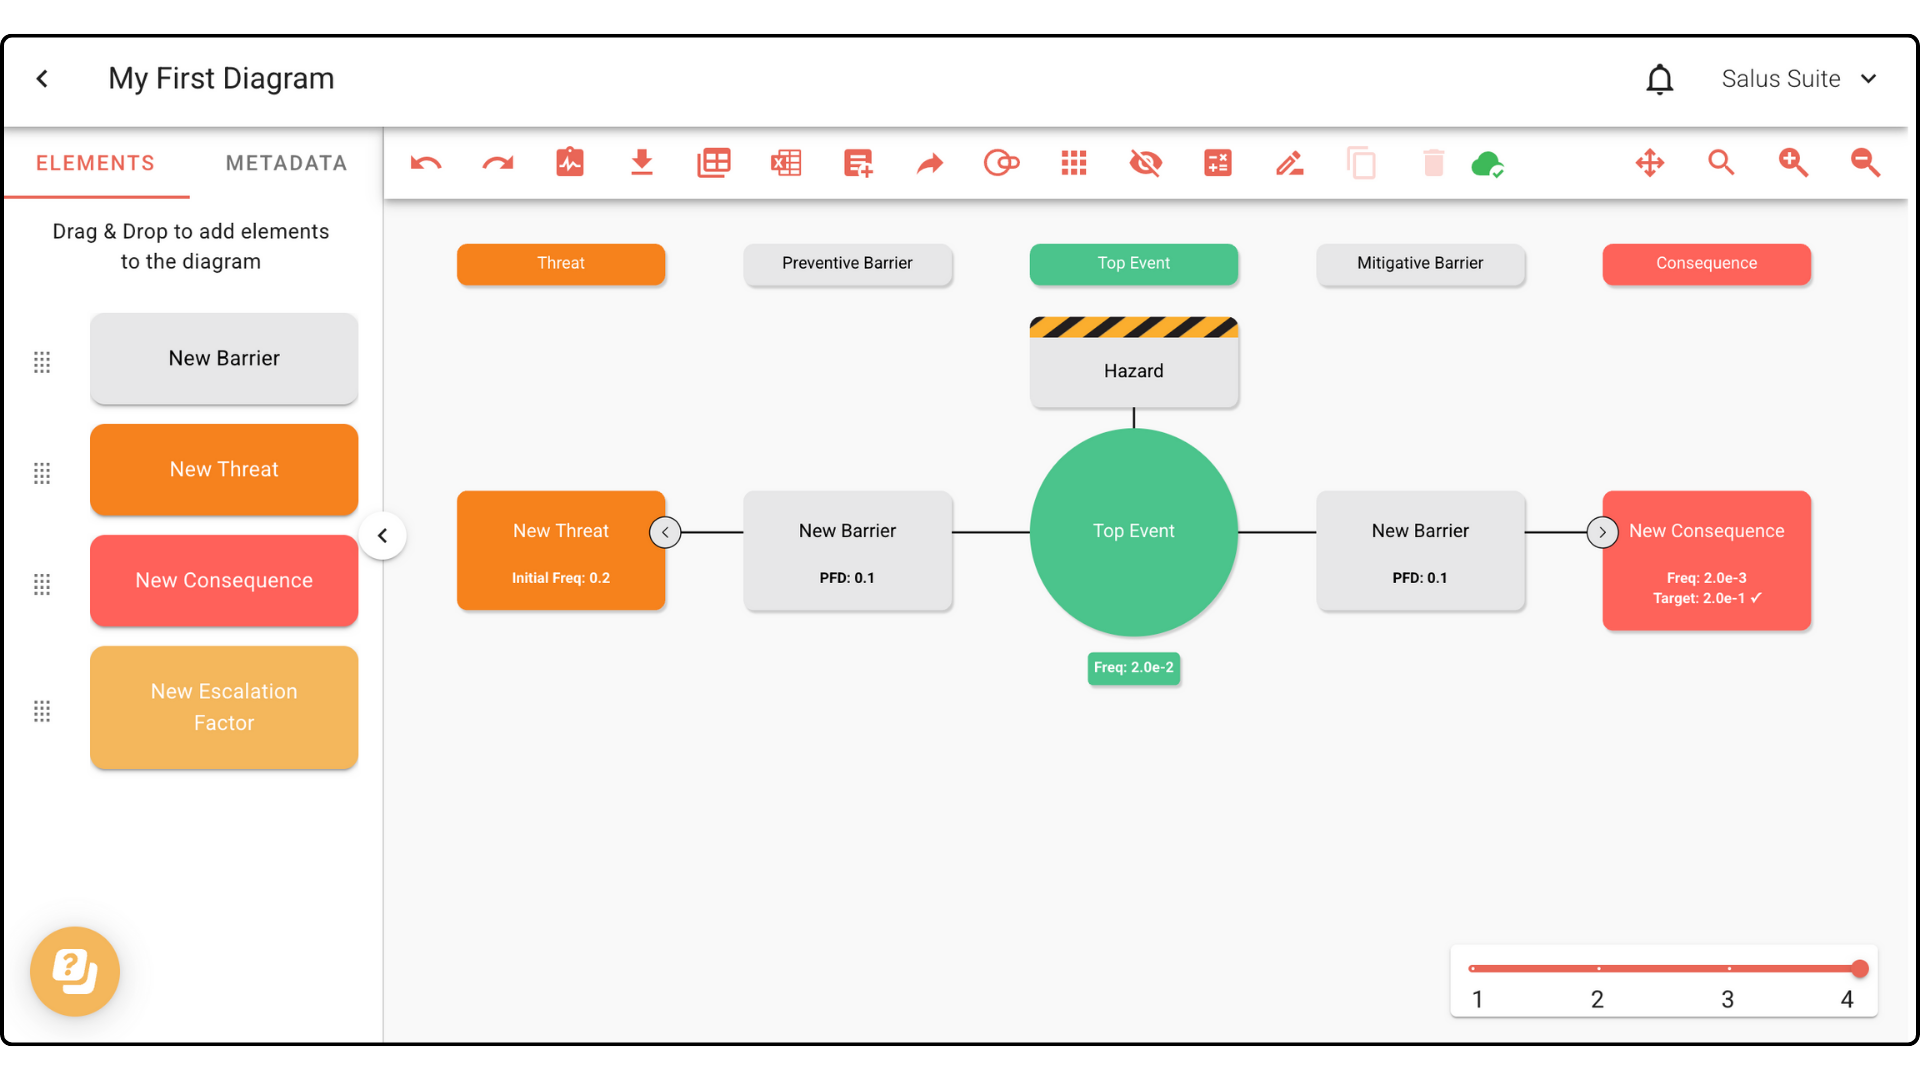
Colour Coding for Barrier Failure Rates
Step 1: Click on LOPA. In the drop-down menu, select Toggle PFD Analysis. 
Step 2: Once selected, your bowtie diagram will enter PFD Analysis Mode. All elements will be coloured according to a traffic light system, based on the value range set for Good and Bad PFDs within the LOPA Settings. 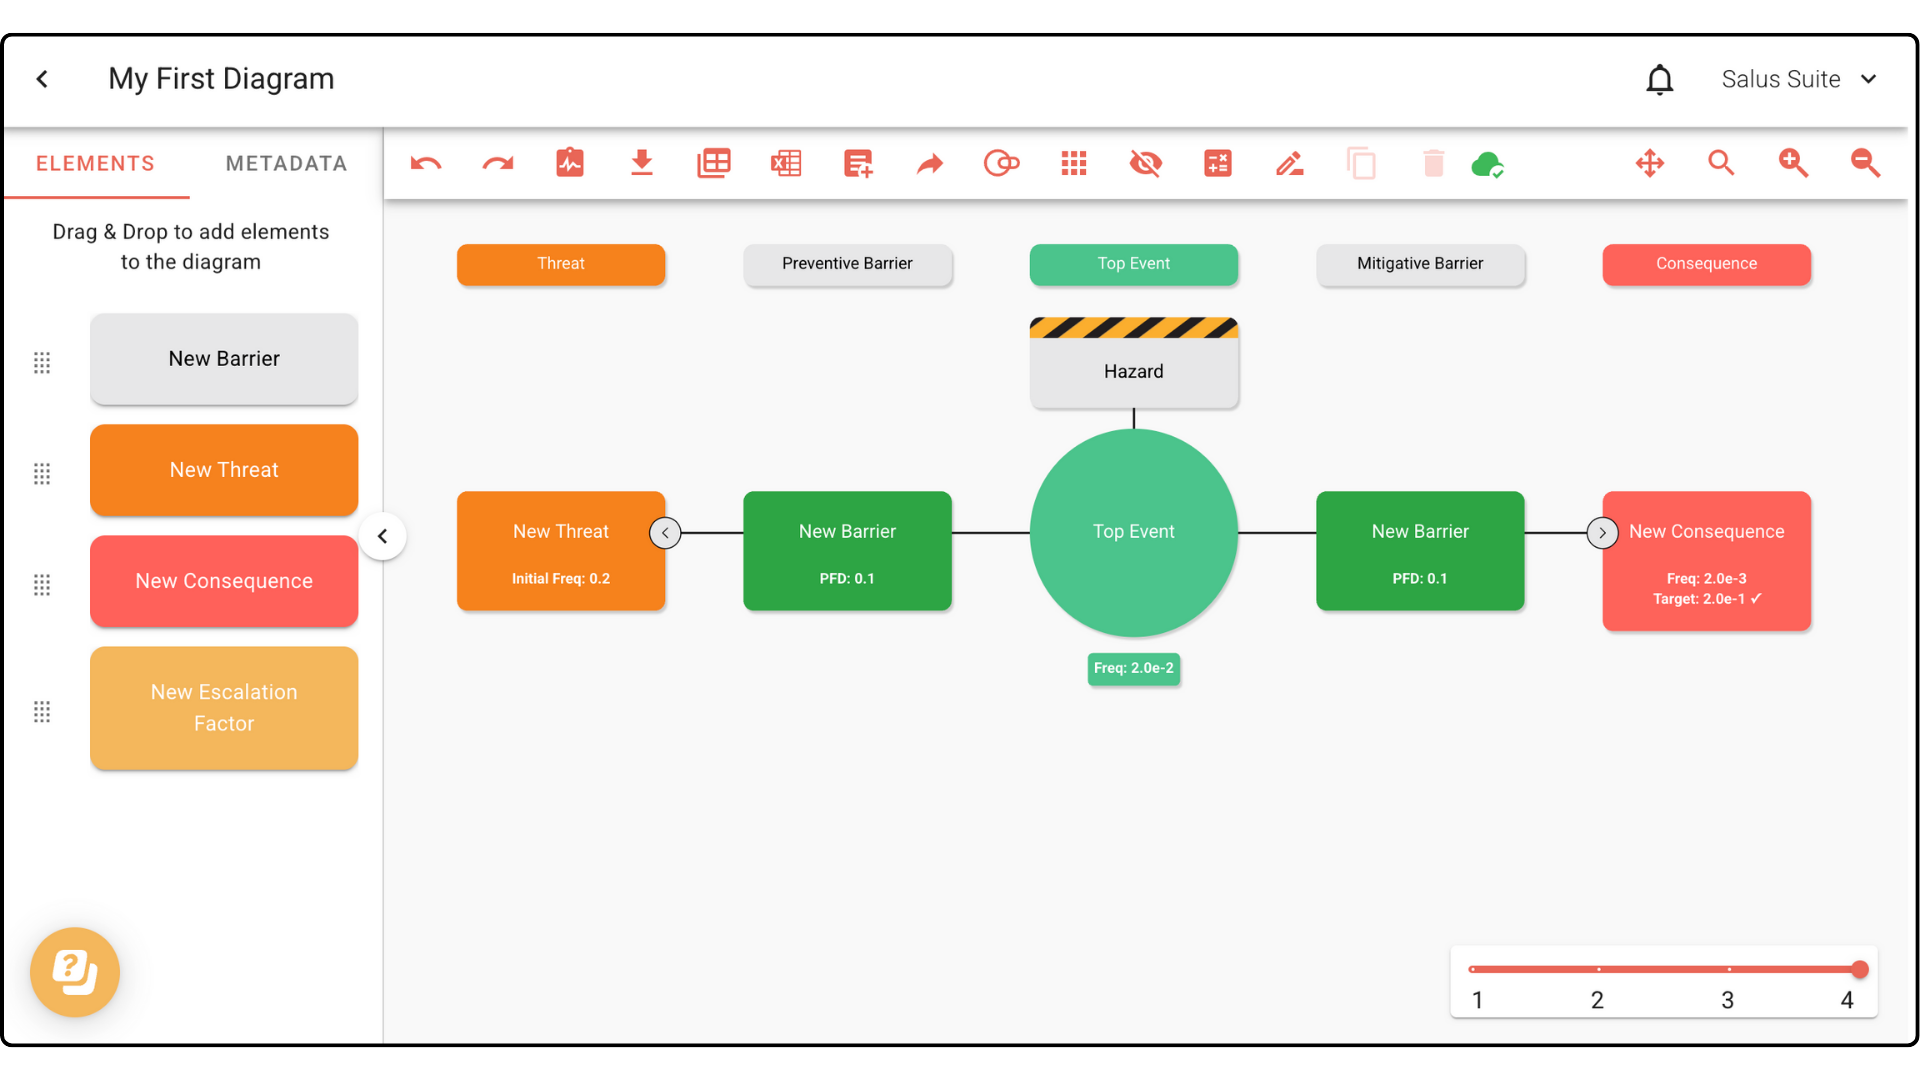
Step 3: To exit PFD Analysis Mode, click LOPA. From the drop-down menu, select Toggle PFD Analysis. The bowtie diagram will revert back to the original colours.
Comparing Consequences to Target Frequencies
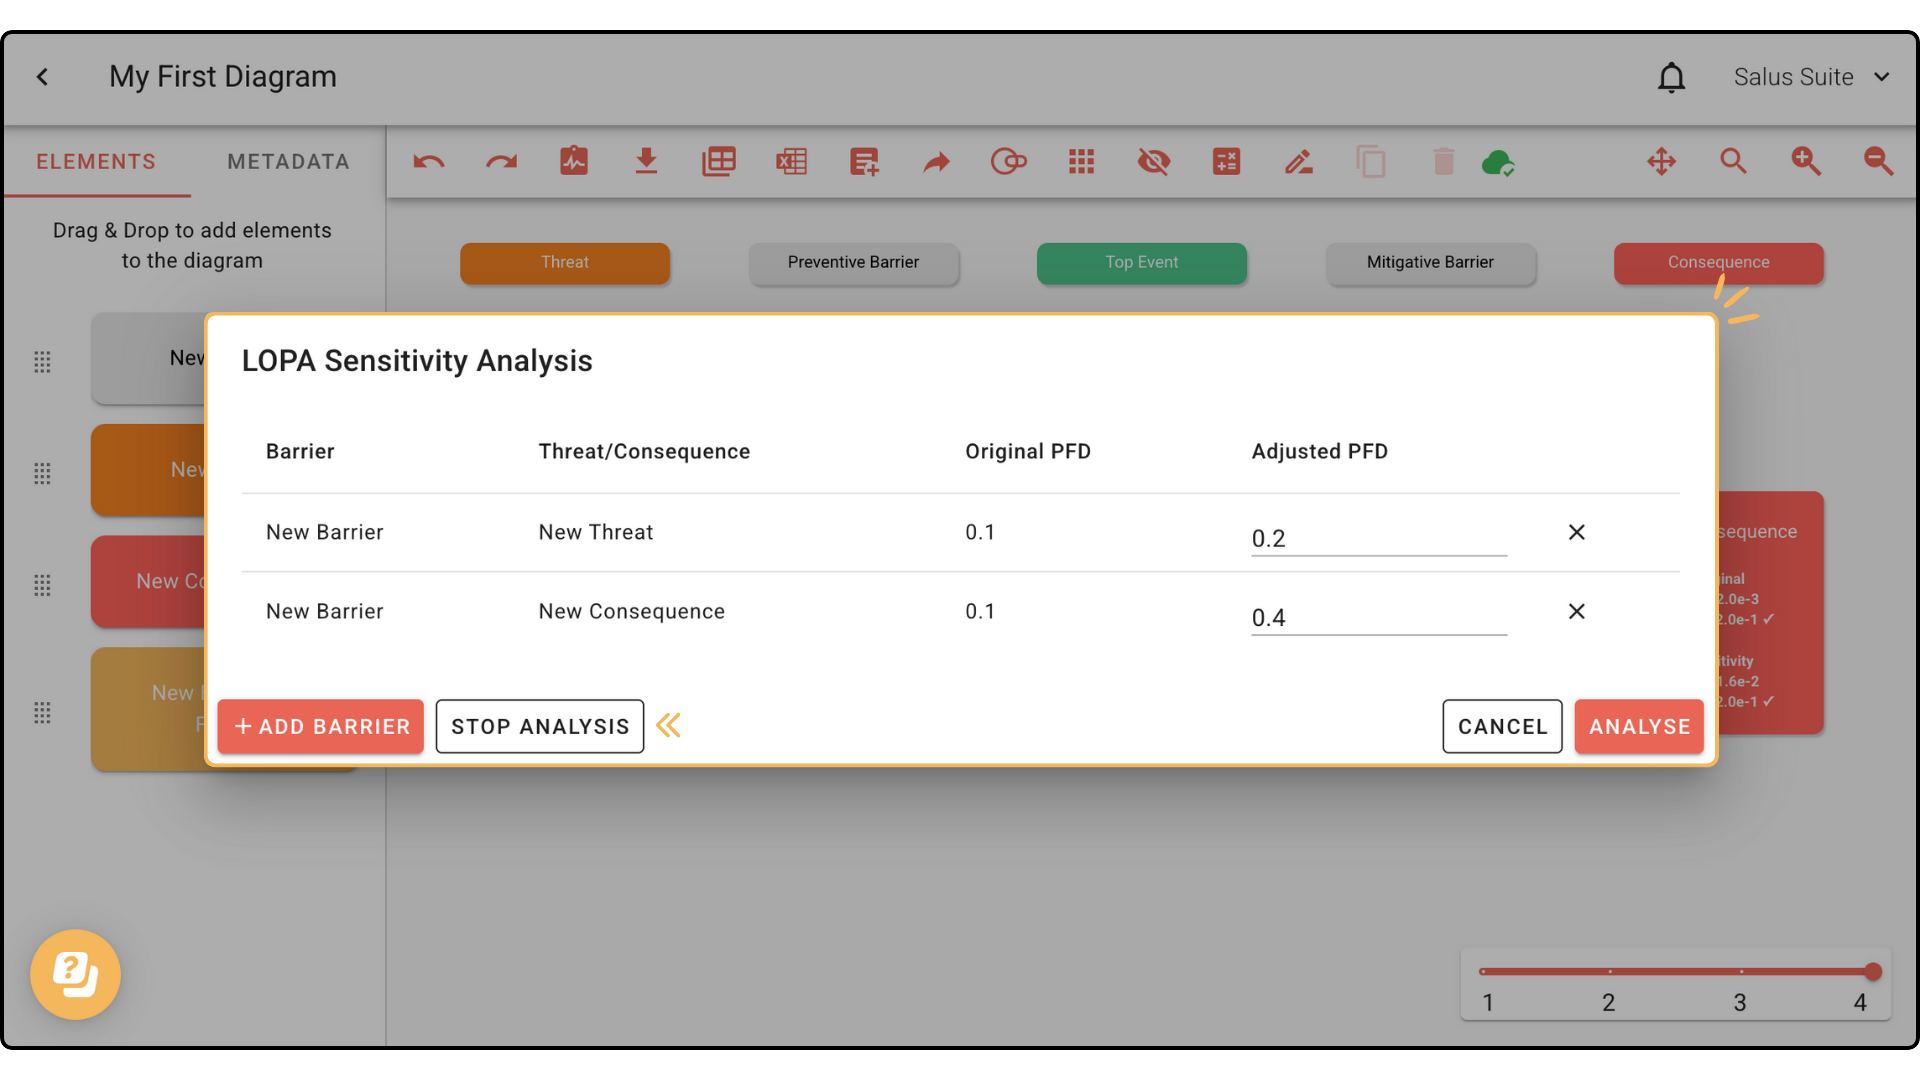
Step 1: Click LOPA. In the drop-down menu, select Sensitivity Analysis. 
Step 2: In the pop-up, click + Add Barrier. 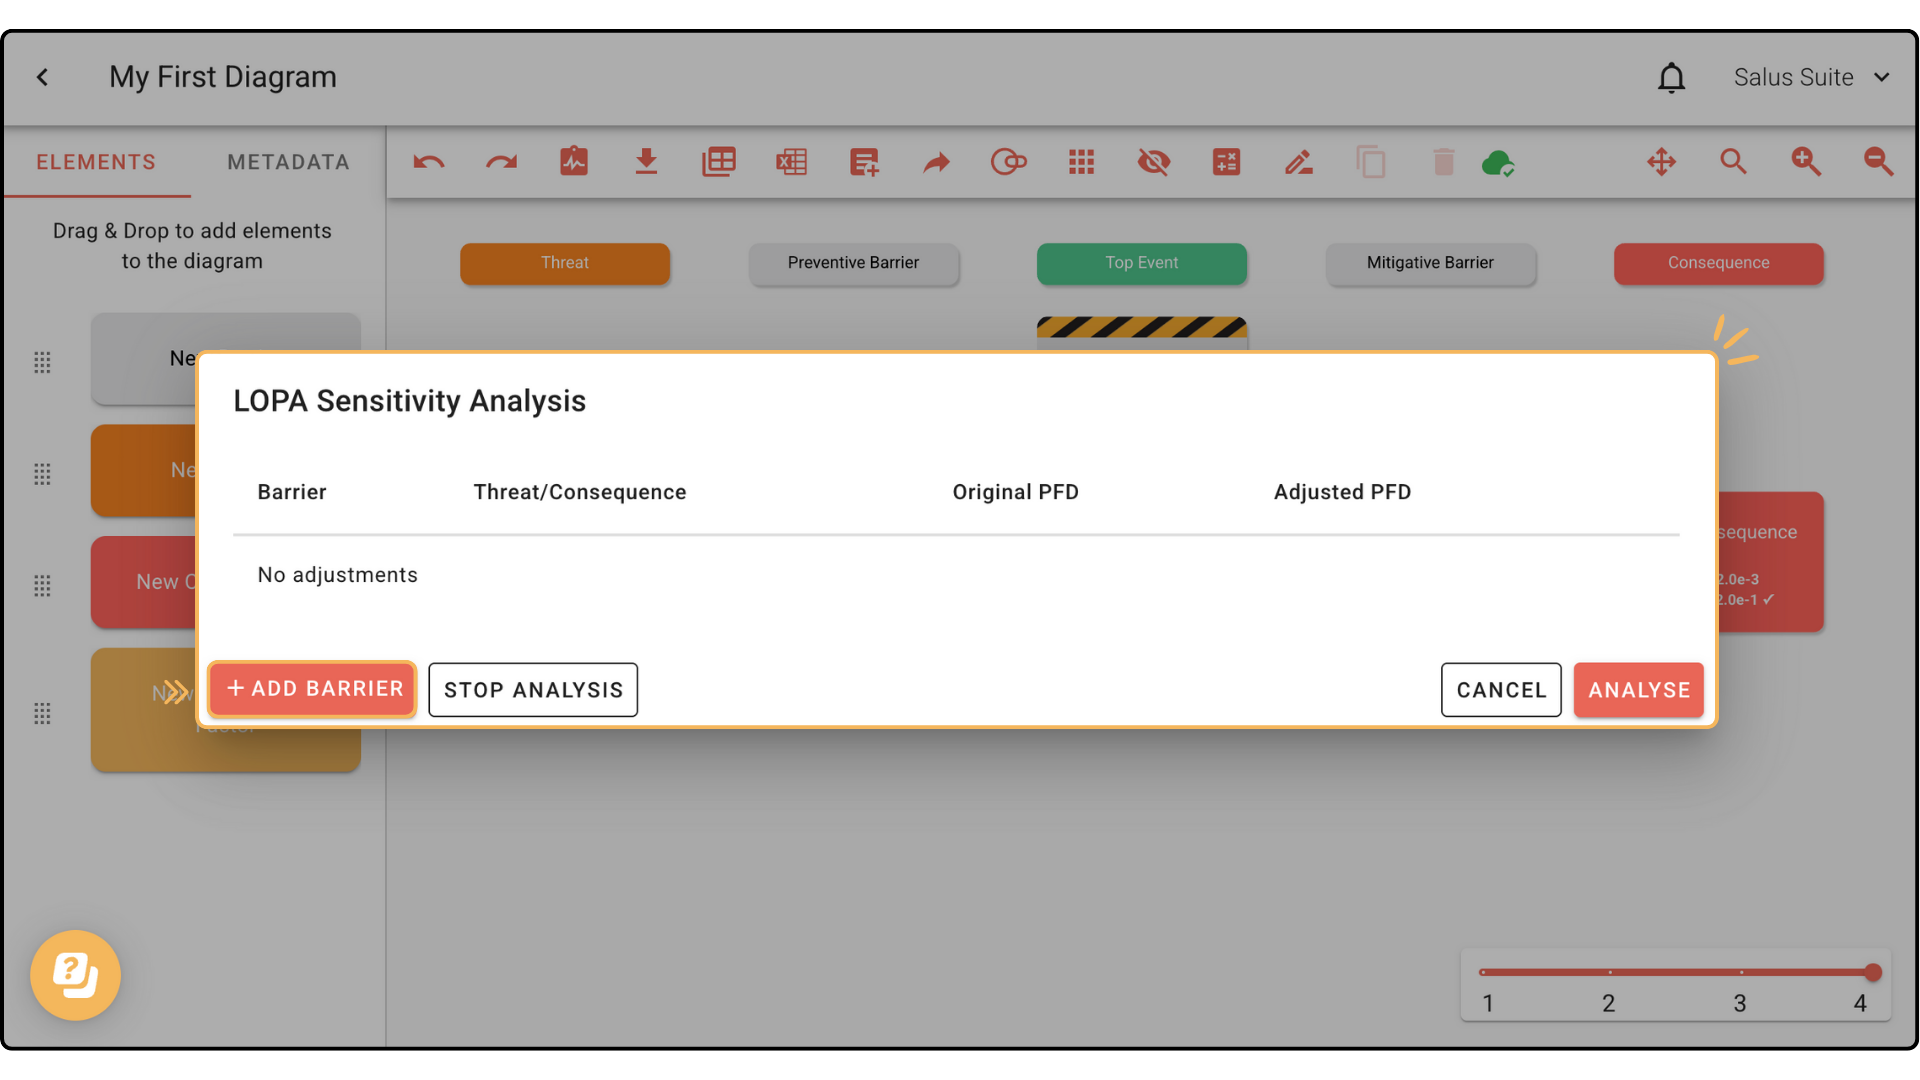
Step 3: Tick which barriers you would like to include within the analysis. Click Select. 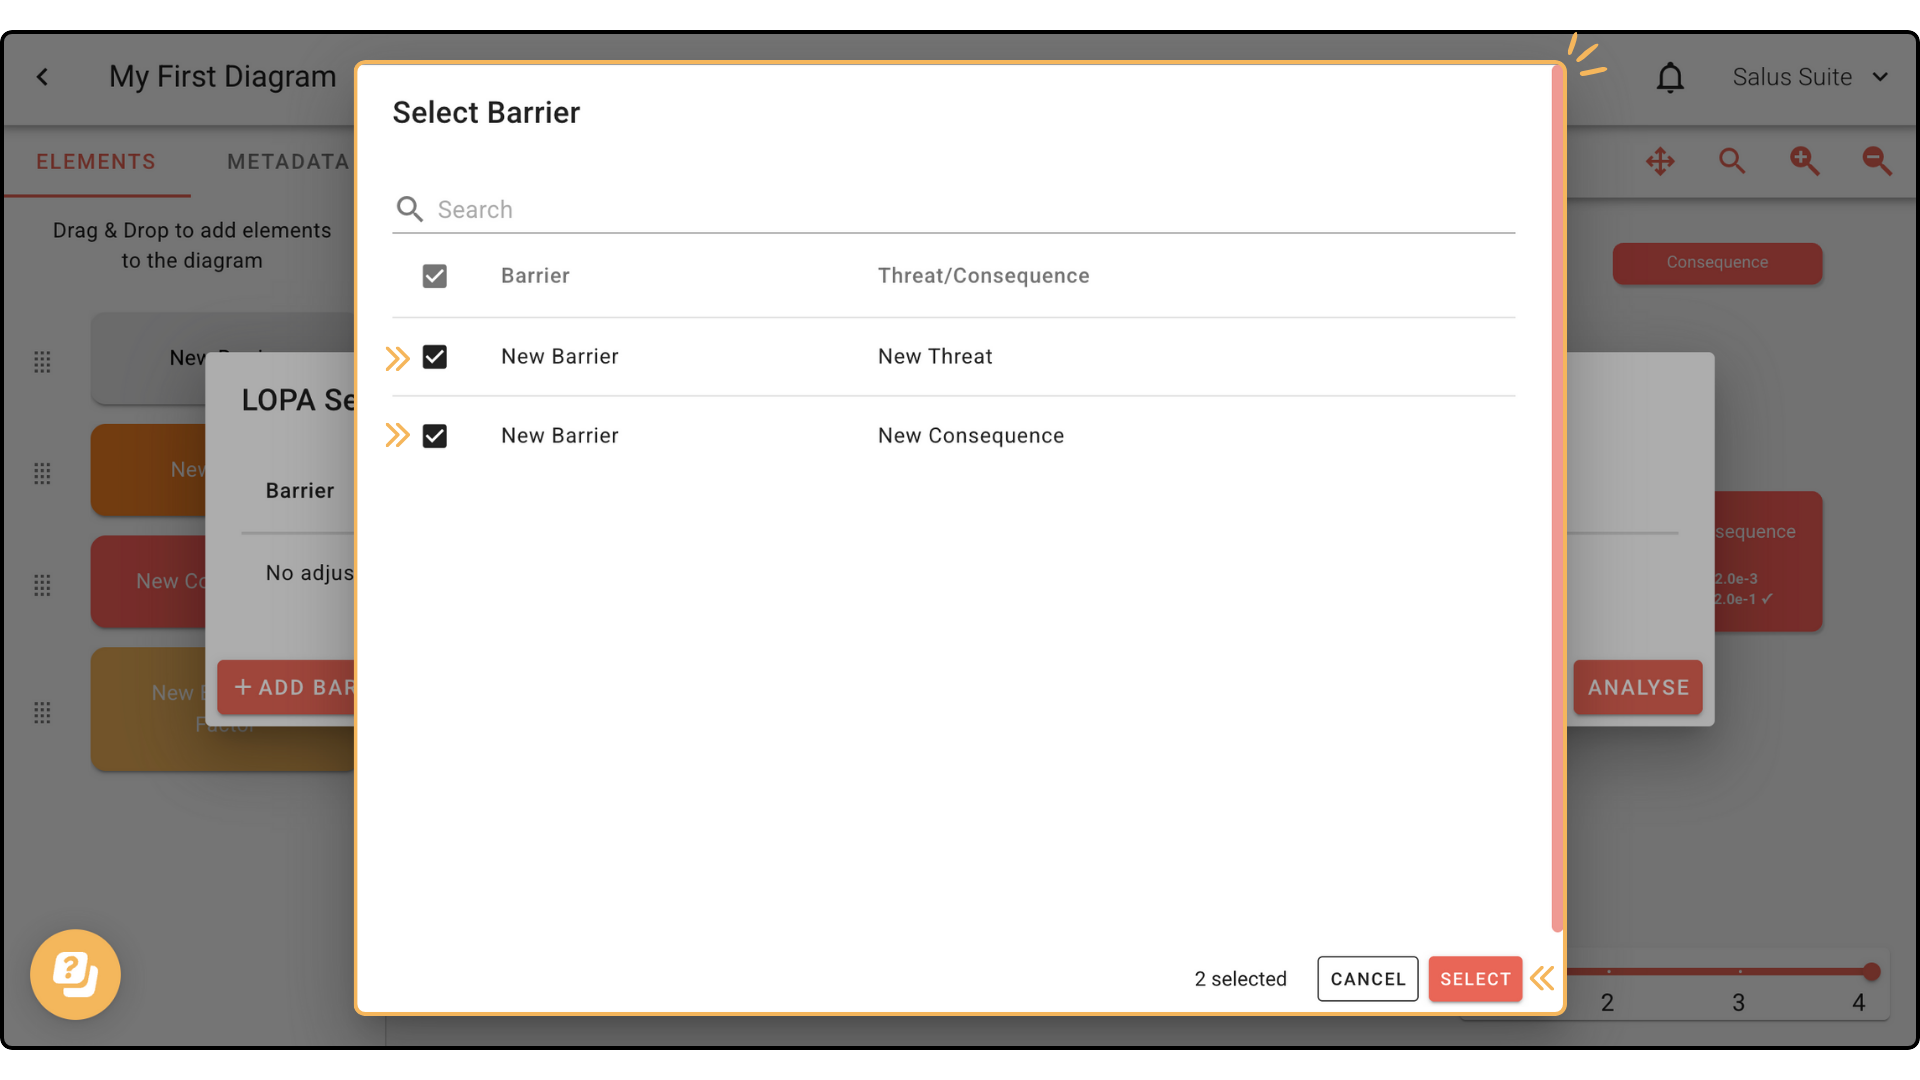
Step 4: In the pop-up, you will be prompted to add the Adjusted PFD values. Once added, click Analyse. 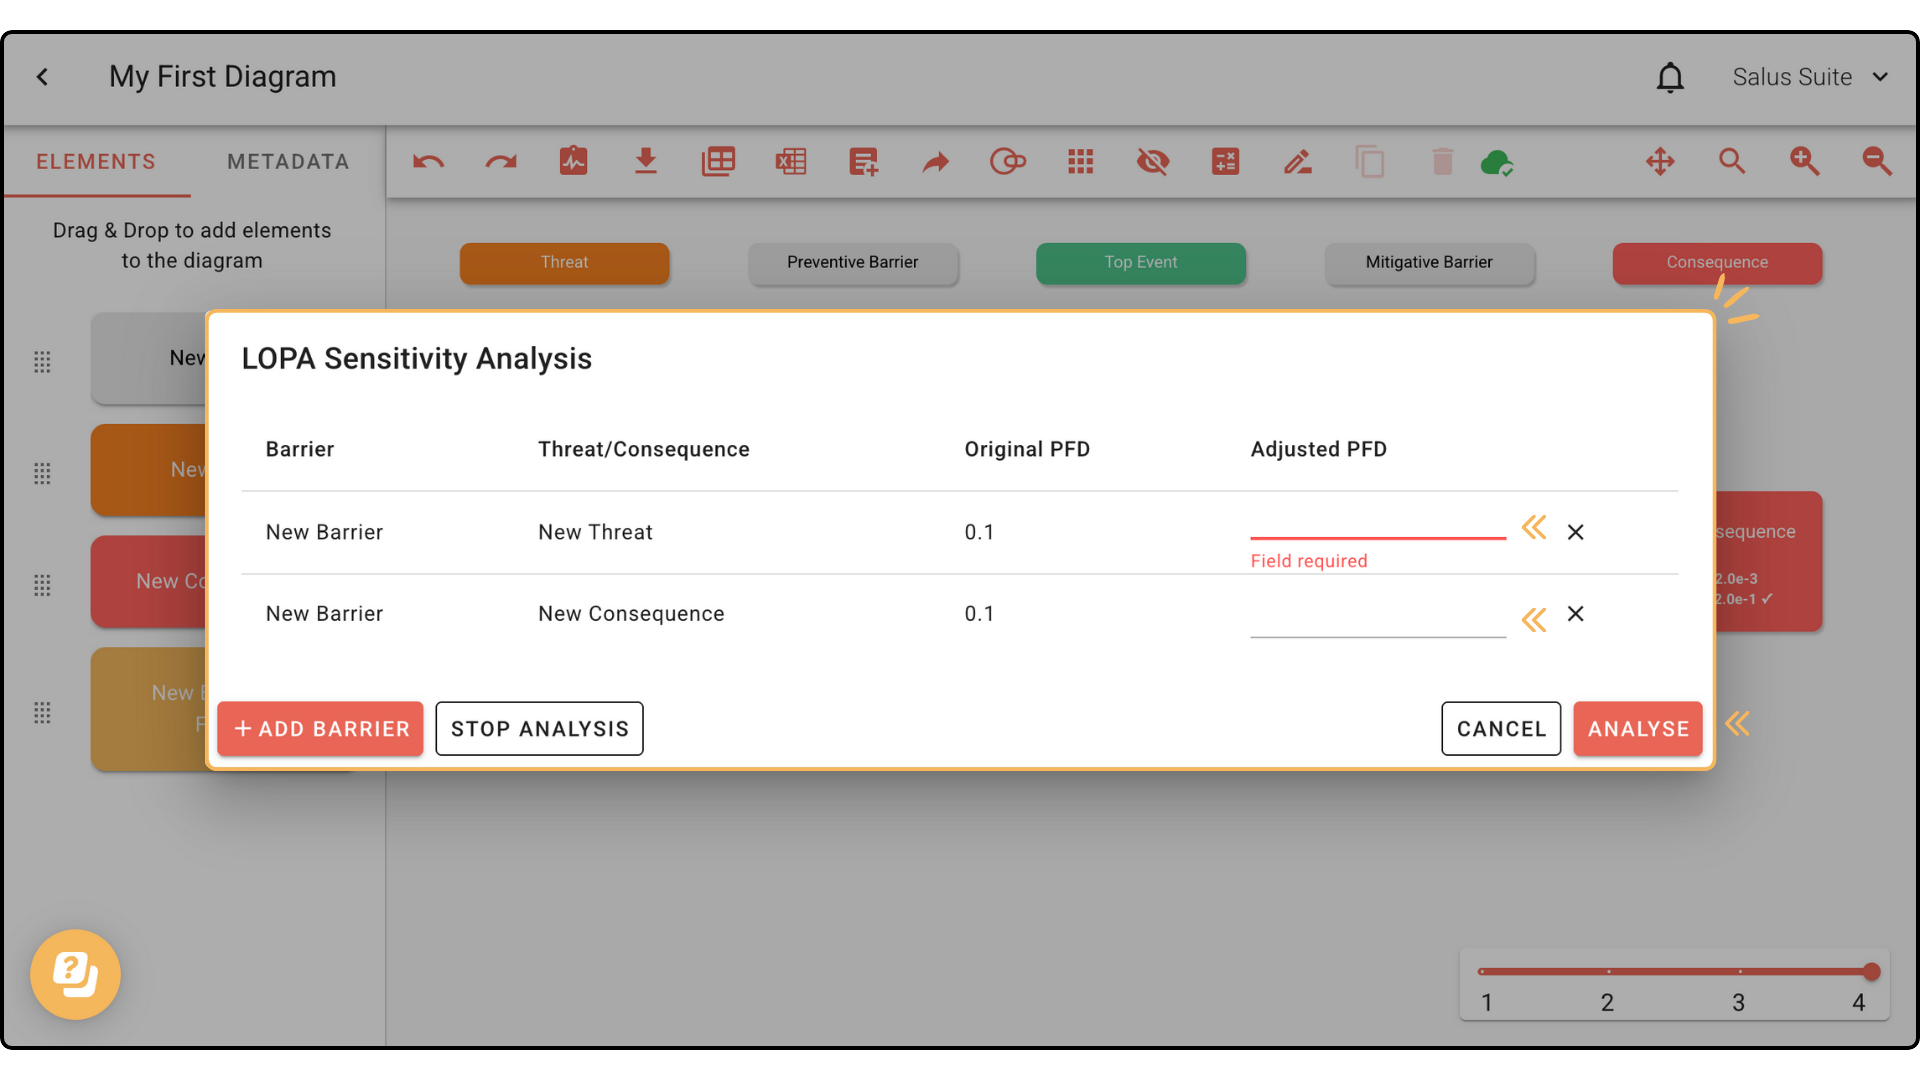
Your bowtie diagram will show both Original PFD and Sensitivity PFD values on the selected elements. 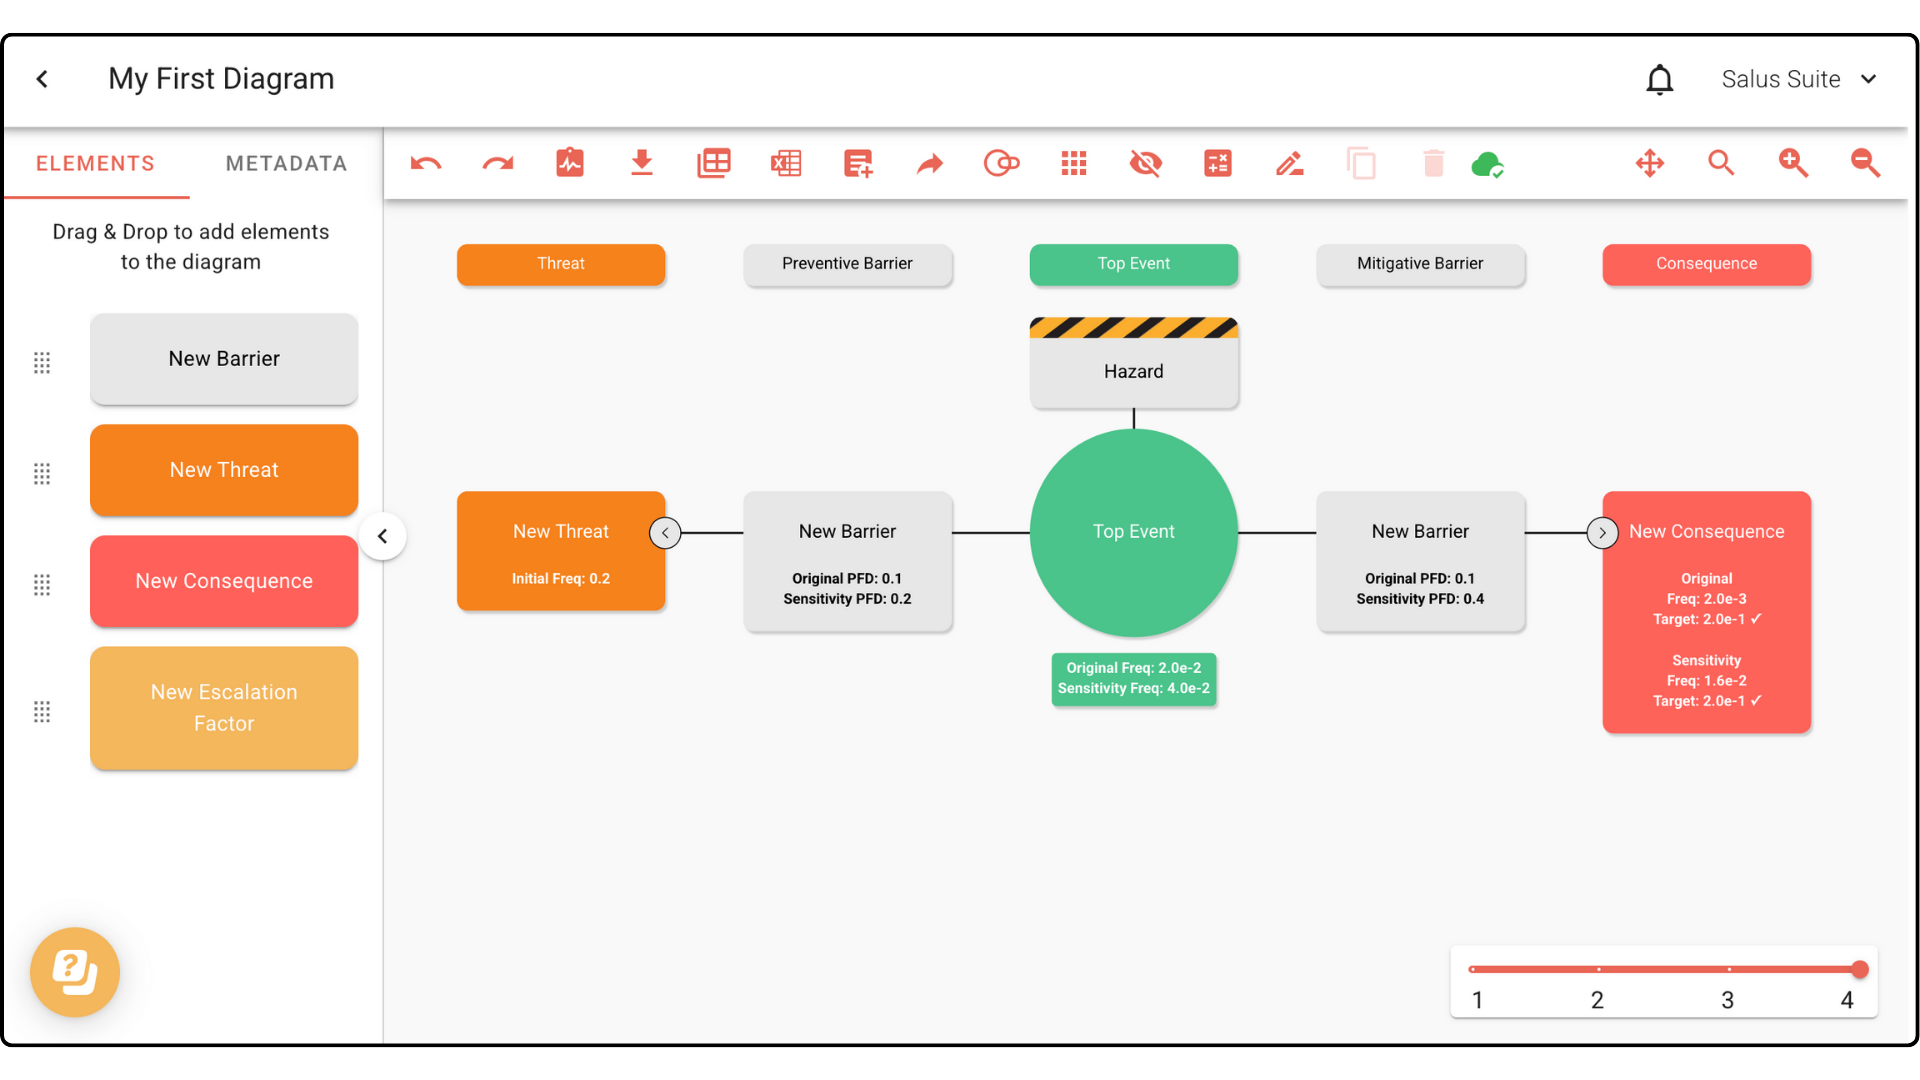
Step 5: To stop the Sensitivity Analysis, click LOPA. In the drop-down menu, click Sensitivity Analysis. In the pop-up, click Stop Analysis.